Subsaharan African vs Immigrants from Chile Poverty
COMPARE
Subsaharan African
Immigrants from Chile
Poverty
Poverty Comparison
Sub-Saharan Africans
Immigrants from Chile
14.5%
POVERTY
0.1/ 100
METRIC RATING
268th/ 347
METRIC RANK
12.2%
POVERTY
56.7/ 100
METRIC RATING
167th/ 347
METRIC RANK
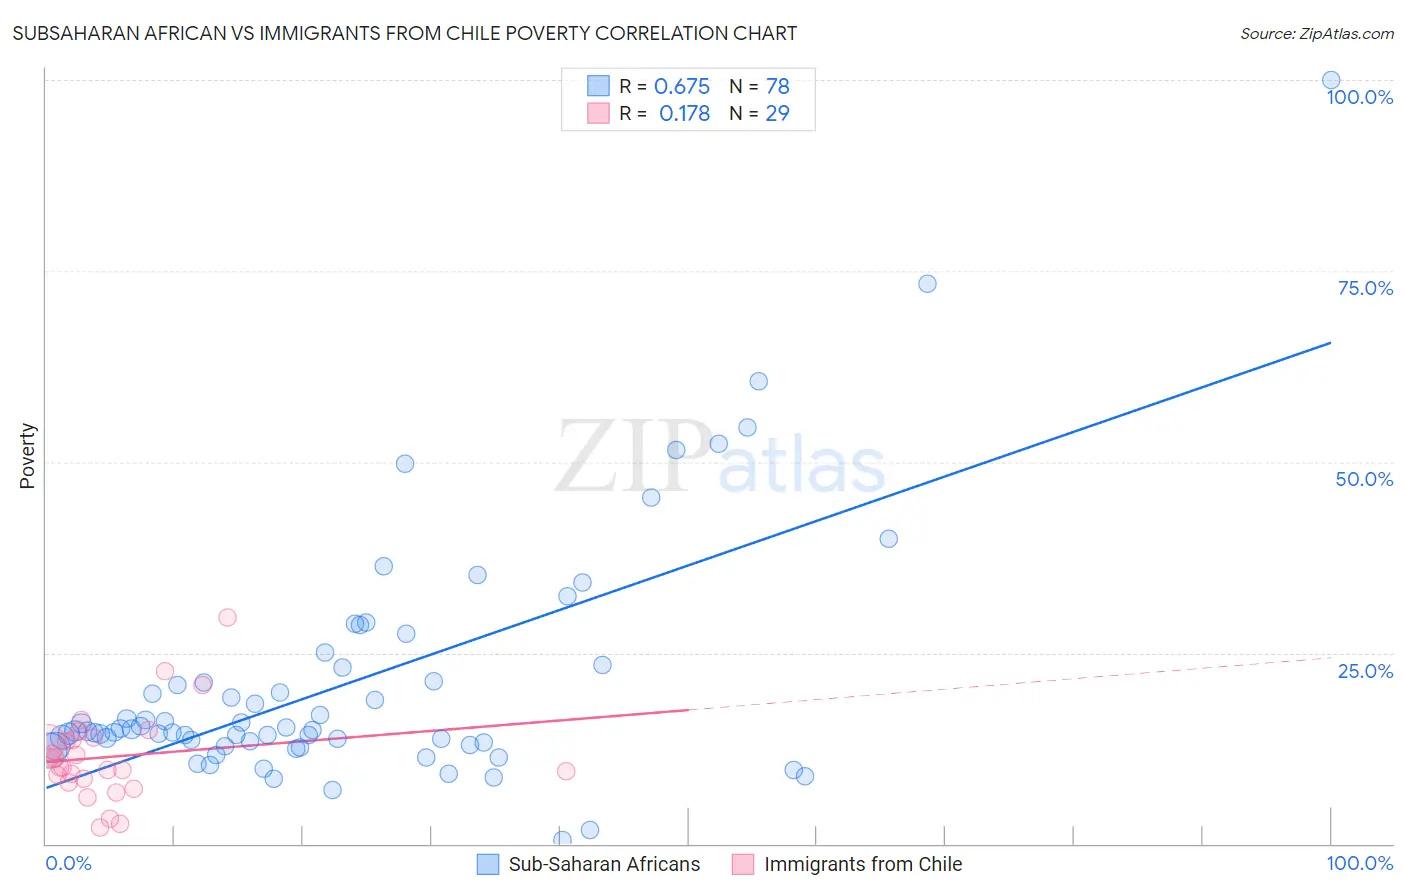
Subsaharan African vs Immigrants from Chile Poverty Correlation Chart
The statistical analysis conducted on geographies consisting of 507,618,351 people shows a significant positive correlation between the proportion of Sub-Saharan Africans and poverty level in the United States with a correlation coefficient (R) of 0.675 and weighted average of 14.5%. Similarly, the statistical analysis conducted on geographies consisting of 218,605,054 people shows a poor positive correlation between the proportion of Immigrants from Chile and poverty level in the United States with a correlation coefficient (R) of 0.178 and weighted average of 12.2%, a difference of 18.8%.
Poverty Correlation Summary
| Measurement | Subsaharan African | Immigrants from Chile |
| Minimum | 0.57% | 2.2% |
| Maximum | 100.0% | 29.7% |
| Range | 99.4% | 27.5% |
| Mean | 21.1% | 11.4% |
| Median | 14.9% | 10.0% |
| Interquartile 25% (IQ1) | 12.9% | 8.2% |
| Interquartile 75% (IQ3) | 23.1% | 13.8% |
| Interquartile Range (IQR) | 10.2% | 5.6% |
| Standard Deviation (Sample) | 16.2% | 5.8% |
| Standard Deviation (Population) | 16.1% | 5.7% |
Similar Demographics by Poverty
Demographics Similar to Sub-Saharan Africans by Poverty
In terms of poverty, the demographic groups most similar to Sub-Saharan Africans are Iroquois (14.5%, a difference of 0.040%), Immigrants from Cuba (14.6%, a difference of 0.15%), Central American (14.6%, a difference of 0.29%), Guyanese (14.5%, a difference of 0.35%), and Immigrants from Guyana (14.5%, a difference of 0.52%).
| Demographics | Rating | Rank | Poverty |
| Cherokee | 0.1 /100 | #261 | Tragic 14.4% |
| Immigrants | Liberia | 0.1 /100 | #262 | Tragic 14.4% |
| Jamaicans | 0.1 /100 | #263 | Tragic 14.4% |
| Immigrants | Jamaica | 0.1 /100 | #264 | Tragic 14.4% |
| Immigrants | Guyana | 0.1 /100 | #265 | Tragic 14.5% |
| Guyanese | 0.1 /100 | #266 | Tragic 14.5% |
| Iroquois | 0.1 /100 | #267 | Tragic 14.5% |
| Sub-Saharan Africans | 0.1 /100 | #268 | Tragic 14.5% |
| Immigrants | Cuba | 0.1 /100 | #269 | Tragic 14.6% |
| Central Americans | 0.1 /100 | #270 | Tragic 14.6% |
| Shoshone | 0.0 /100 | #271 | Tragic 14.7% |
| Chickasaw | 0.0 /100 | #272 | Tragic 14.7% |
| Spanish Americans | 0.0 /100 | #273 | Tragic 14.7% |
| Barbadians | 0.0 /100 | #274 | Tragic 14.8% |
| Immigrants | West Indies | 0.0 /100 | #275 | Tragic 14.8% |
Demographics Similar to Immigrants from Chile by Poverty
In terms of poverty, the demographic groups most similar to Immigrants from Chile are Venezuelan (12.2%, a difference of 0.020%), Immigrants from Venezuela (12.2%, a difference of 0.020%), Colombian (12.2%, a difference of 0.11%), Immigrants from Albania (12.2%, a difference of 0.11%), and White/Caucasian (12.3%, a difference of 0.13%).
| Demographics | Rating | Rank | Poverty |
| Immigrants | Nepal | 60.4 /100 | #160 | Good 12.2% |
| Immigrants | Fiji | 59.1 /100 | #161 | Average 12.2% |
| Ethiopians | 59.1 /100 | #162 | Average 12.2% |
| Immigrants | Ethiopia | 58.6 /100 | #163 | Average 12.2% |
| Colombians | 57.8 /100 | #164 | Average 12.2% |
| Immigrants | Albania | 57.7 /100 | #165 | Average 12.2% |
| Venezuelans | 56.9 /100 | #166 | Average 12.2% |
| Immigrants | Chile | 56.7 /100 | #167 | Average 12.2% |
| Immigrants | Venezuela | 56.5 /100 | #168 | Average 12.2% |
| Whites/Caucasians | 55.4 /100 | #169 | Average 12.3% |
| Immigrants | Oceania | 54.6 /100 | #170 | Average 12.3% |
| Immigrants | Spain | 51.3 /100 | #171 | Average 12.3% |
| Immigrants | Portugal | 50.5 /100 | #172 | Average 12.3% |
| Celtics | 50.1 /100 | #173 | Average 12.3% |
| Lebanese | 50.0 /100 | #174 | Average 12.3% |