Immigrants from Morocco vs Immigrants from Chile Poverty
COMPARE
Immigrants from Morocco
Immigrants from Chile
Poverty
Poverty Comparison
Immigrants from Morocco
Immigrants from Chile
12.4%
POVERTY
44.0/ 100
METRIC RATING
179th/ 347
METRIC RANK
12.2%
POVERTY
56.7/ 100
METRIC RATING
167th/ 347
METRIC RANK
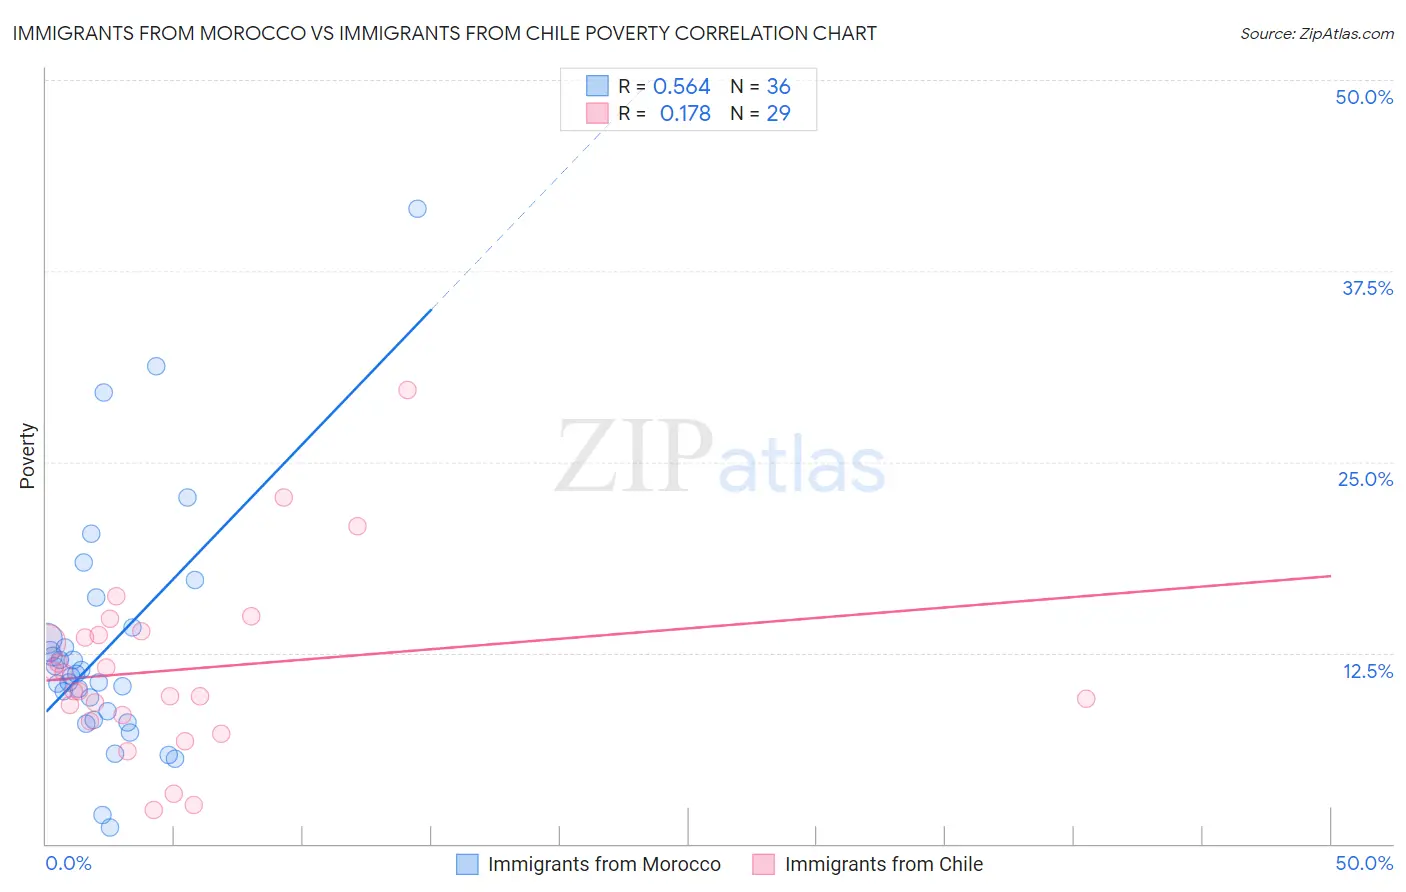
Immigrants from Morocco vs Immigrants from Chile Poverty Correlation Chart
The statistical analysis conducted on geographies consisting of 178,904,952 people shows a substantial positive correlation between the proportion of Immigrants from Morocco and poverty level in the United States with a correlation coefficient (R) of 0.564 and weighted average of 12.4%. Similarly, the statistical analysis conducted on geographies consisting of 218,605,054 people shows a poor positive correlation between the proportion of Immigrants from Chile and poverty level in the United States with a correlation coefficient (R) of 0.178 and weighted average of 12.2%, a difference of 1.2%.
Poverty Correlation Summary
| Measurement | Immigrants from Morocco | Immigrants from Chile |
| Minimum | 1.1% | 2.2% |
| Maximum | 41.6% | 29.7% |
| Range | 40.5% | 27.5% |
| Mean | 12.9% | 11.4% |
| Median | 11.1% | 10.0% |
| Interquartile 25% (IQ1) | 8.4% | 8.2% |
| Interquartile 75% (IQ3) | 13.8% | 13.8% |
| Interquartile Range (IQR) | 5.4% | 5.6% |
| Standard Deviation (Sample) | 8.0% | 5.8% |
| Standard Deviation (Population) | 7.9% | 5.7% |
Demographics Similar to Immigrants from Morocco and Immigrants from Chile by Poverty
In terms of poverty, the demographic groups most similar to Immigrants from Morocco are Mongolian (12.4%, a difference of 0.040%), Uruguayan (12.4%, a difference of 0.060%), Immigrants from Afghanistan (12.4%, a difference of 0.19%), Immigrants from Cameroon (12.4%, a difference of 0.23%), and Immigrants from Syria (12.3%, a difference of 0.33%). Similarly, the demographic groups most similar to Immigrants from Chile are Venezuelan (12.2%, a difference of 0.020%), Immigrants from Venezuela (12.2%, a difference of 0.020%), Colombian (12.2%, a difference of 0.11%), Immigrants from Albania (12.2%, a difference of 0.11%), and White/Caucasian (12.3%, a difference of 0.13%).
| Demographics | Rating | Rank | Poverty |
| Immigrants | Ethiopia | 58.6 /100 | #163 | Average 12.2% |
| Colombians | 57.8 /100 | #164 | Average 12.2% |
| Immigrants | Albania | 57.7 /100 | #165 | Average 12.2% |
| Venezuelans | 56.9 /100 | #166 | Average 12.2% |
| Immigrants | Chile | 56.7 /100 | #167 | Average 12.2% |
| Immigrants | Venezuela | 56.5 /100 | #168 | Average 12.2% |
| Whites/Caucasians | 55.4 /100 | #169 | Average 12.3% |
| Immigrants | Oceania | 54.6 /100 | #170 | Average 12.3% |
| Immigrants | Spain | 51.3 /100 | #171 | Average 12.3% |
| Immigrants | Portugal | 50.5 /100 | #172 | Average 12.3% |
| Celtics | 50.1 /100 | #173 | Average 12.3% |
| Lebanese | 50.0 /100 | #174 | Average 12.3% |
| South Americans | 48.7 /100 | #175 | Average 12.3% |
| Immigrants | Colombia | 47.7 /100 | #176 | Average 12.3% |
| Immigrants | Syria | 47.5 /100 | #177 | Average 12.3% |
| Uruguayans | 44.7 /100 | #178 | Average 12.4% |
| Immigrants | Morocco | 44.0 /100 | #179 | Average 12.4% |
| Mongolians | 43.6 /100 | #180 | Average 12.4% |
| Immigrants | Afghanistan | 42.1 /100 | #181 | Average 12.4% |
| Immigrants | Cameroon | 41.7 /100 | #182 | Average 12.4% |
| Immigrants | Iraq | 40.2 /100 | #183 | Average 12.4% |