Immigrants from Cabo Verde vs Cree Male Poverty
COMPARE
Immigrants from Cabo Verde
Cree
Male Poverty
Male Poverty Comparison
Immigrants from Cabo Verde
Cree
13.7%
MALE POVERTY
0.0/ 100
METRIC RATING
282nd/ 347
METRIC RANK
13.3%
MALE POVERTY
0.0/ 100
METRIC RATING
270th/ 347
METRIC RANK
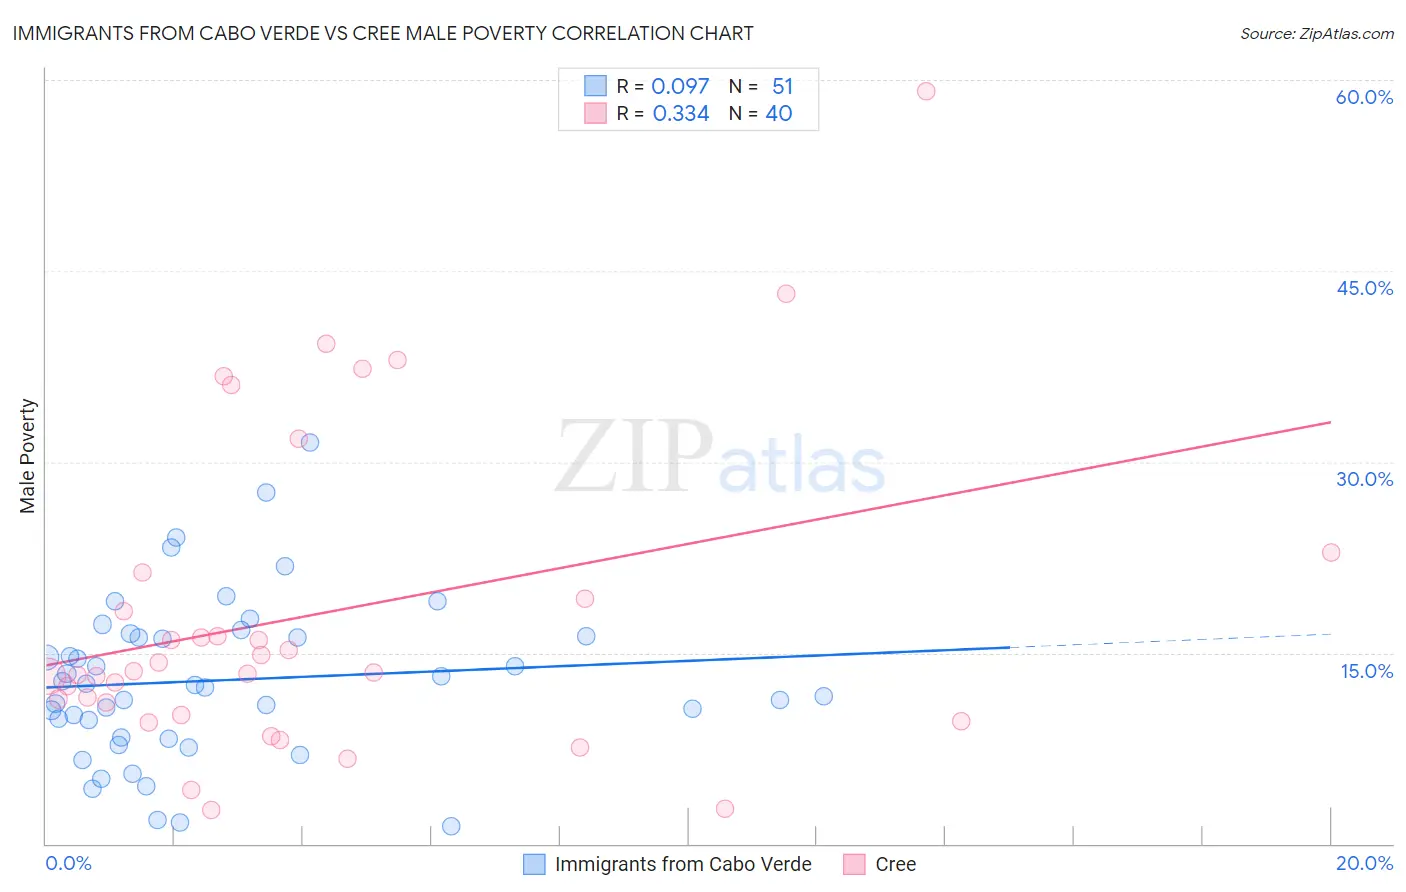
Immigrants from Cabo Verde vs Cree Male Poverty Correlation Chart
The statistical analysis conducted on geographies consisting of 38,133,137 people shows a slight positive correlation between the proportion of Immigrants from Cabo Verde and poverty level among males in the United States with a correlation coefficient (R) of 0.097 and weighted average of 13.7%. Similarly, the statistical analysis conducted on geographies consisting of 76,204,291 people shows a mild positive correlation between the proportion of Cree and poverty level among males in the United States with a correlation coefficient (R) of 0.334 and weighted average of 13.3%, a difference of 2.8%.
Male Poverty Correlation Summary
| Measurement | Immigrants from Cabo Verde | Cree |
| Minimum | 1.4% | 2.7% |
| Maximum | 31.5% | 59.1% |
| Range | 30.1% | 56.4% |
| Mean | 12.8% | 18.0% |
| Median | 12.5% | 13.5% |
| Interquartile 25% (IQ1) | 8.4% | 10.6% |
| Interquartile 75% (IQ3) | 16.3% | 20.2% |
| Interquartile Range (IQR) | 7.9% | 9.6% |
| Standard Deviation (Sample) | 6.3% | 12.5% |
| Standard Deviation (Population) | 6.2% | 12.4% |
Demographics Similar to Immigrants from Cabo Verde and Cree by Male Poverty
In terms of male poverty, the demographic groups most similar to Immigrants from Cabo Verde are Comanche (13.8%, a difference of 0.20%), Immigrants from Haiti (13.8%, a difference of 0.21%), West Indian (13.8%, a difference of 0.23%), Shoshone (13.8%, a difference of 0.26%), and Yaqui (13.7%, a difference of 0.27%). Similarly, the demographic groups most similar to Cree are Spanish American (13.4%, a difference of 0.030%), Guyanese (13.3%, a difference of 0.47%), Subsaharan African (13.3%, a difference of 0.69%), Immigrants from Jamaica (13.3%, a difference of 0.72%), and Immigrants from Bahamas (13.5%, a difference of 0.78%).
| Demographics | Rating | Rank | Male Poverty |
| Immigrants | Guyana | 0.1 /100 | #266 | Tragic 13.2% |
| Immigrants | Jamaica | 0.1 /100 | #267 | Tragic 13.3% |
| Sub-Saharan Africans | 0.1 /100 | #268 | Tragic 13.3% |
| Guyanese | 0.0 /100 | #269 | Tragic 13.3% |
| Cree | 0.0 /100 | #270 | Tragic 13.3% |
| Spanish Americans | 0.0 /100 | #271 | Tragic 13.4% |
| Immigrants | Bahamas | 0.0 /100 | #272 | Tragic 13.5% |
| Chickasaw | 0.0 /100 | #273 | Tragic 13.5% |
| Immigrants | West Indies | 0.0 /100 | #274 | Tragic 13.5% |
| Barbadians | 0.0 /100 | #275 | Tragic 13.6% |
| Immigrants | Latin America | 0.0 /100 | #276 | Tragic 13.6% |
| Bangladeshis | 0.0 /100 | #277 | Tragic 13.6% |
| Belizeans | 0.0 /100 | #278 | Tragic 13.6% |
| Haitians | 0.0 /100 | #279 | Tragic 13.7% |
| Mexicans | 0.0 /100 | #280 | Tragic 13.7% |
| Yaqui | 0.0 /100 | #281 | Tragic 13.7% |
| Immigrants | Cabo Verde | 0.0 /100 | #282 | Tragic 13.7% |
| Comanche | 0.0 /100 | #283 | Tragic 13.8% |
| Immigrants | Haiti | 0.0 /100 | #284 | Tragic 13.8% |
| West Indians | 0.0 /100 | #285 | Tragic 13.8% |
| Shoshone | 0.0 /100 | #286 | Tragic 13.8% |