Immigrants from Korea vs Cree Male Poverty
COMPARE
Immigrants from Korea
Cree
Male Poverty
Male Poverty Comparison
Immigrants from Korea
Cree
9.7%
MALE POVERTY
99.6/ 100
METRIC RATING
28th/ 347
METRIC RANK
13.3%
MALE POVERTY
0.0/ 100
METRIC RATING
270th/ 347
METRIC RANK
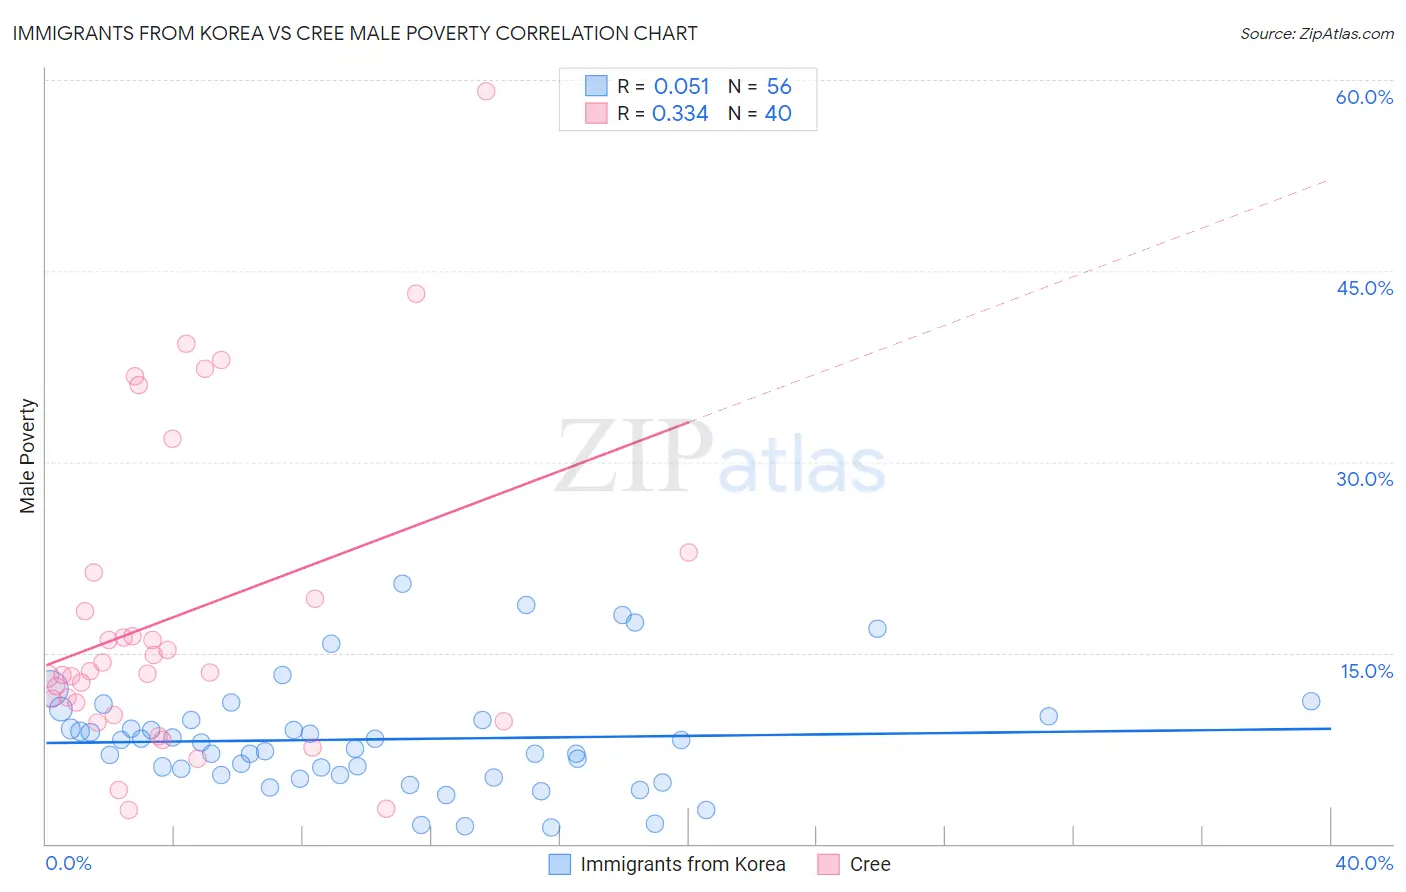
Immigrants from Korea vs Cree Male Poverty Correlation Chart
The statistical analysis conducted on geographies consisting of 415,786,791 people shows a slight positive correlation between the proportion of Immigrants from Korea and poverty level among males in the United States with a correlation coefficient (R) of 0.051 and weighted average of 9.7%. Similarly, the statistical analysis conducted on geographies consisting of 76,204,291 people shows a mild positive correlation between the proportion of Cree and poverty level among males in the United States with a correlation coefficient (R) of 0.334 and weighted average of 13.3%, a difference of 37.6%.
Male Poverty Correlation Summary
| Measurement | Immigrants from Korea | Cree |
| Minimum | 1.2% | 2.7% |
| Maximum | 20.5% | 59.1% |
| Range | 19.2% | 56.4% |
| Mean | 8.2% | 18.0% |
| Median | 7.7% | 13.5% |
| Interquartile 25% (IQ1) | 5.4% | 10.6% |
| Interquartile 75% (IQ3) | 9.7% | 20.2% |
| Interquartile Range (IQR) | 4.3% | 9.6% |
| Standard Deviation (Sample) | 4.3% | 12.5% |
| Standard Deviation (Population) | 4.3% | 12.4% |
Similar Demographics by Male Poverty
Demographics Similar to Immigrants from Korea by Male Poverty
In terms of male poverty, the demographic groups most similar to Immigrants from Korea are Greek (9.7%, a difference of 0.040%), Danish (9.7%, a difference of 0.080%), Polish (9.7%, a difference of 0.12%), Tongan (9.7%, a difference of 0.14%), and Burmese (9.7%, a difference of 0.21%).
| Demographics | Rating | Rank | Male Poverty |
| Immigrants | Scotland | 99.7 /100 | #21 | Exceptional 9.6% |
| Croatians | 99.7 /100 | #22 | Exceptional 9.6% |
| Italians | 99.7 /100 | #23 | Exceptional 9.6% |
| Swedes | 99.7 /100 | #24 | Exceptional 9.6% |
| Eastern Europeans | 99.6 /100 | #25 | Exceptional 9.6% |
| Burmese | 99.6 /100 | #26 | Exceptional 9.7% |
| Danes | 99.6 /100 | #27 | Exceptional 9.7% |
| Immigrants | Korea | 99.6 /100 | #28 | Exceptional 9.7% |
| Greeks | 99.6 /100 | #29 | Exceptional 9.7% |
| Poles | 99.5 /100 | #30 | Exceptional 9.7% |
| Tongans | 99.5 /100 | #31 | Exceptional 9.7% |
| Macedonians | 99.5 /100 | #32 | Exceptional 9.7% |
| Immigrants | Northern Europe | 99.5 /100 | #33 | Exceptional 9.7% |
| Immigrants | Poland | 99.5 /100 | #34 | Exceptional 9.8% |
| Iranians | 99.4 /100 | #35 | Exceptional 9.8% |
Demographics Similar to Cree by Male Poverty
In terms of male poverty, the demographic groups most similar to Cree are Spanish American (13.4%, a difference of 0.030%), Guyanese (13.3%, a difference of 0.47%), Subsaharan African (13.3%, a difference of 0.69%), Immigrants from Jamaica (13.3%, a difference of 0.72%), and Immigrants from Bahamas (13.5%, a difference of 0.78%).
| Demographics | Rating | Rank | Male Poverty |
| Central Americans | 0.1 /100 | #263 | Tragic 13.2% |
| Iroquois | 0.1 /100 | #264 | Tragic 13.2% |
| Jamaicans | 0.1 /100 | #265 | Tragic 13.2% |
| Immigrants | Guyana | 0.1 /100 | #266 | Tragic 13.2% |
| Immigrants | Jamaica | 0.1 /100 | #267 | Tragic 13.3% |
| Sub-Saharan Africans | 0.1 /100 | #268 | Tragic 13.3% |
| Guyanese | 0.0 /100 | #269 | Tragic 13.3% |
| Cree | 0.0 /100 | #270 | Tragic 13.3% |
| Spanish Americans | 0.0 /100 | #271 | Tragic 13.4% |
| Immigrants | Bahamas | 0.0 /100 | #272 | Tragic 13.5% |
| Chickasaw | 0.0 /100 | #273 | Tragic 13.5% |
| Immigrants | West Indies | 0.0 /100 | #274 | Tragic 13.5% |
| Barbadians | 0.0 /100 | #275 | Tragic 13.6% |
| Immigrants | Latin America | 0.0 /100 | #276 | Tragic 13.6% |
| Bangladeshis | 0.0 /100 | #277 | Tragic 13.6% |