Yuman vs Immigrants from Kuwait No Vehicles in Household
COMPARE
Yuman
Immigrants from Kuwait
No Vehicles in Household
No Vehicles in Household Comparison
Yuman
Immigrants from Kuwait
14.9%
NO VEHICLES IN HOUSEHOLD
0.0/ 100
METRIC RATING
300th/ 347
METRIC RANK
9.4%
NO VEHICLES IN HOUSEHOLD
95.1/ 100
METRIC RATING
111th/ 347
METRIC RANK
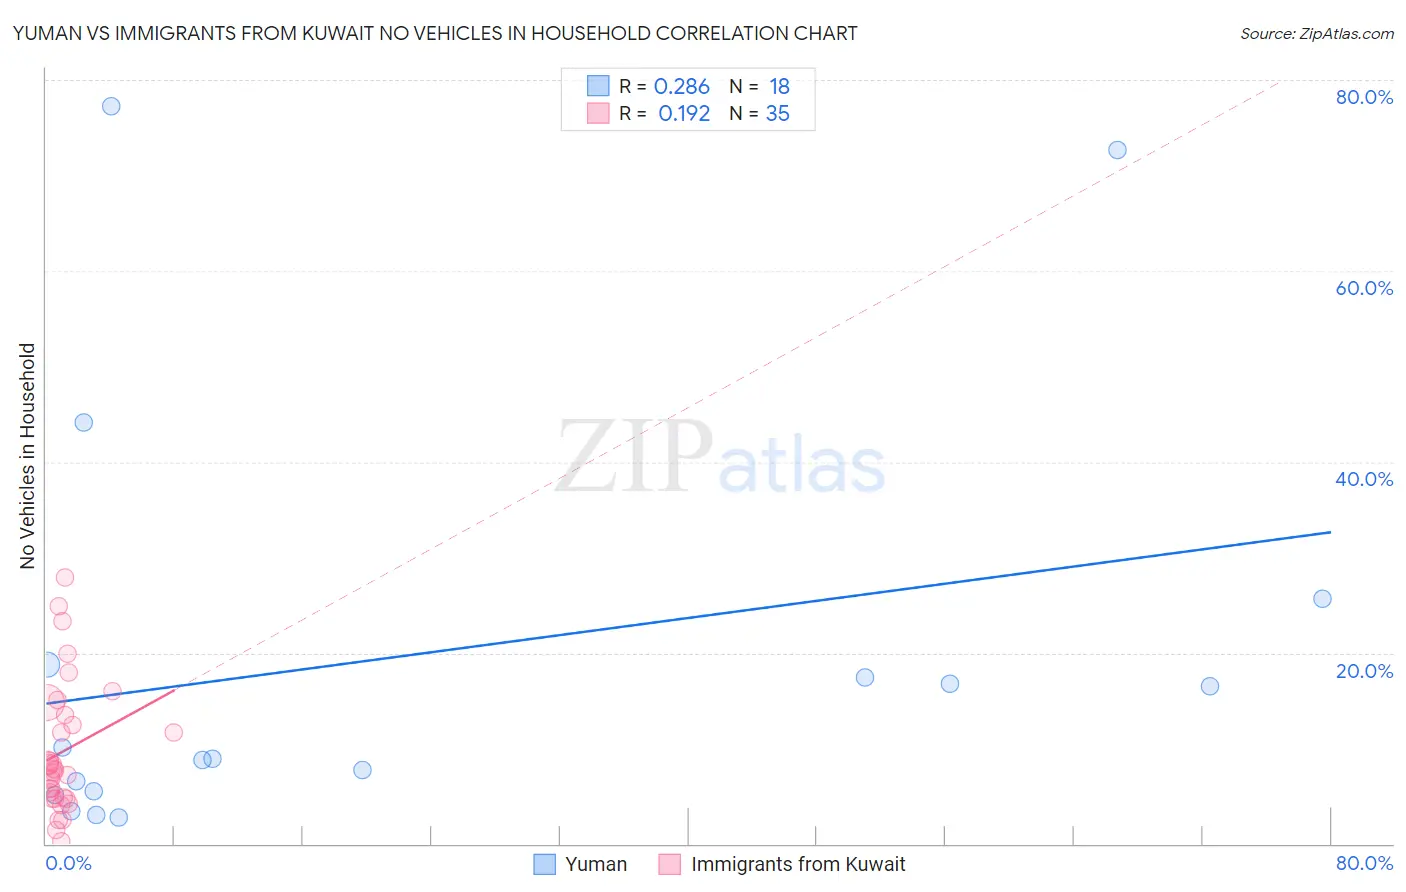
Yuman vs Immigrants from Kuwait No Vehicles in Household Correlation Chart
The statistical analysis conducted on geographies consisting of 40,640,909 people shows a weak positive correlation between the proportion of Yuman and percentage of households with no vehicle available in the United States with a correlation coefficient (R) of 0.286 and weighted average of 14.9%. Similarly, the statistical analysis conducted on geographies consisting of 136,758,114 people shows a poor positive correlation between the proportion of Immigrants from Kuwait and percentage of households with no vehicle available in the United States with a correlation coefficient (R) of 0.192 and weighted average of 9.4%, a difference of 58.6%.
No Vehicles in Household Correlation Summary
| Measurement | Yuman | Immigrants from Kuwait |
| Minimum | 2.8% | 0.29% |
| Maximum | 77.3% | 27.9% |
| Range | 74.5% | 27.7% |
| Mean | 19.5% | 9.7% |
| Median | 9.5% | 7.8% |
| Interquartile 25% (IQ1) | 5.5% | 4.8% |
| Interquartile 75% (IQ3) | 18.8% | 13.5% |
| Interquartile Range (IQR) | 13.3% | 8.8% |
| Standard Deviation (Sample) | 22.6% | 6.8% |
| Standard Deviation (Population) | 21.9% | 6.7% |
Similar Demographics by No Vehicles in Household
Demographics Similar to Yuman by No Vehicles in Household
In terms of no vehicles in household, the demographic groups most similar to Yuman are Immigrants from Ukraine (14.9%, a difference of 0.0%), Haitian (14.9%, a difference of 0.48%), Immigrants from Western Africa (15.0%, a difference of 1.0%), Immigrants from Greece (14.7%, a difference of 1.1%), and Moroccan (14.7%, a difference of 1.3%).
| Demographics | Rating | Rank | No Vehicles in Household |
| Immigrants | Jamaica | 0.0 /100 | #293 | Tragic 14.2% |
| Belizeans | 0.0 /100 | #294 | Tragic 14.3% |
| Paraguayans | 0.0 /100 | #295 | Tragic 14.4% |
| Immigrants | Spain | 0.0 /100 | #296 | Tragic 14.5% |
| Immigrants | Panama | 0.0 /100 | #297 | Tragic 14.6% |
| Moroccans | 0.0 /100 | #298 | Tragic 14.7% |
| Immigrants | Greece | 0.0 /100 | #299 | Tragic 14.7% |
| Yuman | 0.0 /100 | #300 | Tragic 14.9% |
| Immigrants | Ukraine | 0.0 /100 | #301 | Tragic 14.9% |
| Haitians | 0.0 /100 | #302 | Tragic 14.9% |
| Immigrants | Western Africa | 0.0 /100 | #303 | Tragic 15.0% |
| Immigrants | Russia | 0.0 /100 | #304 | Tragic 15.1% |
| Immigrants | China | 0.0 /100 | #305 | Tragic 15.2% |
| Immigrants | Belize | 0.0 /100 | #306 | Tragic 15.4% |
| Immigrants | Haiti | 0.0 /100 | #307 | Tragic 15.4% |
Demographics Similar to Immigrants from Kuwait by No Vehicles in Household
In terms of no vehicles in household, the demographic groups most similar to Immigrants from Kuwait are Armenian (9.4%, a difference of 0.090%), Immigrants from Netherlands (9.4%, a difference of 0.18%), Serbian (9.4%, a difference of 0.61%), Navajo (9.4%, a difference of 0.68%), and Japanese (9.4%, a difference of 0.74%).
| Demographics | Rating | Rank | No Vehicles in Household |
| Zimbabweans | 98.0 /100 | #104 | Exceptional 9.0% |
| Spanish Americans | 97.9 /100 | #105 | Exceptional 9.1% |
| Laotians | 97.8 /100 | #106 | Exceptional 9.1% |
| Hispanics or Latinos | 97.7 /100 | #107 | Exceptional 9.1% |
| Mexican American Indians | 97.6 /100 | #108 | Exceptional 9.1% |
| Maltese | 97.6 /100 | #109 | Exceptional 9.1% |
| Delaware | 97.2 /100 | #110 | Exceptional 9.2% |
| Immigrants | Kuwait | 95.1 /100 | #111 | Exceptional 9.4% |
| Armenians | 95.0 /100 | #112 | Exceptional 9.4% |
| Immigrants | Netherlands | 94.8 /100 | #113 | Exceptional 9.4% |
| Serbians | 94.3 /100 | #114 | Exceptional 9.4% |
| Navajo | 94.2 /100 | #115 | Exceptional 9.4% |
| Japanese | 94.1 /100 | #116 | Exceptional 9.4% |
| Chippewa | 93.8 /100 | #117 | Exceptional 9.4% |
| Greeks | 92.9 /100 | #118 | Exceptional 9.5% |