Scandinavian vs Immigrants from Kuwait Single Female Poverty
COMPARE
Scandinavian
Immigrants from Kuwait
Single Female Poverty
Single Female Poverty Comparison
Scandinavians
Immigrants from Kuwait
21.1%
SINGLE FEMALE POVERTY
45.2/ 100
METRIC RATING
177th/ 347
METRIC RANK
20.3%
SINGLE FEMALE POVERTY
90.4/ 100
METRIC RATING
139th/ 347
METRIC RANK
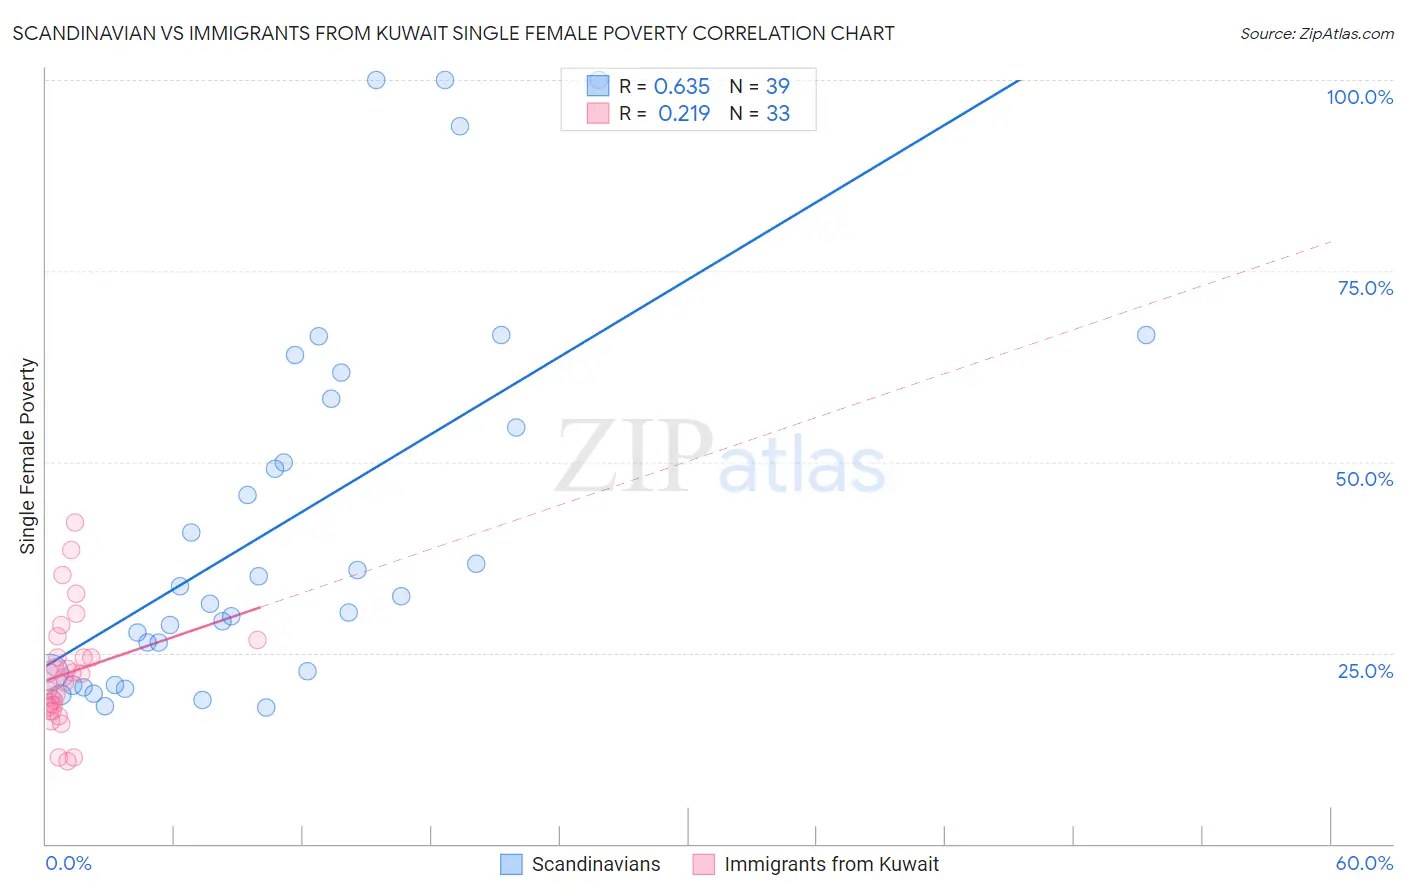
Scandinavian vs Immigrants from Kuwait Single Female Poverty Correlation Chart
The statistical analysis conducted on geographies consisting of 461,288,786 people shows a significant positive correlation between the proportion of Scandinavians and poverty level among single females in the United States with a correlation coefficient (R) of 0.635 and weighted average of 21.1%. Similarly, the statistical analysis conducted on geographies consisting of 136,370,378 people shows a weak positive correlation between the proportion of Immigrants from Kuwait and poverty level among single females in the United States with a correlation coefficient (R) of 0.219 and weighted average of 20.3%, a difference of 3.9%.
Single Female Poverty Correlation Summary
| Measurement | Scandinavian | Immigrants from Kuwait |
| Minimum | 17.8% | 10.8% |
| Maximum | 100.0% | 42.0% |
| Range | 82.2% | 31.3% |
| Mean | 42.1% | 22.4% |
| Median | 32.4% | 21.7% |
| Interquartile 25% (IQ1) | 22.3% | 17.7% |
| Interquartile 75% (IQ3) | 58.3% | 25.5% |
| Interquartile Range (IQR) | 36.0% | 7.9% |
| Standard Deviation (Sample) | 24.6% | 7.3% |
| Standard Deviation (Population) | 24.3% | 7.2% |
Similar Demographics by Single Female Poverty
Demographics Similar to Scandinavians by Single Female Poverty
In terms of single female poverty, the demographic groups most similar to Scandinavians are Canadian (21.1%, a difference of 0.010%), Immigrants from Bosnia and Herzegovina (21.1%, a difference of 0.020%), Czech (21.0%, a difference of 0.10%), British (21.1%, a difference of 0.14%), and Spanish American Indian (21.1%, a difference of 0.17%).
| Demographics | Rating | Rank | Single Female Poverty |
| New Zealanders | 53.2 /100 | #170 | Average 21.0% |
| Moroccans | 52.8 /100 | #171 | Average 21.0% |
| Guyanese | 52.0 /100 | #172 | Average 21.0% |
| Immigrants | Guyana | 50.6 /100 | #173 | Average 21.0% |
| Cubans | 50.0 /100 | #174 | Average 21.0% |
| Czechs | 46.8 /100 | #175 | Average 21.0% |
| Canadians | 45.4 /100 | #176 | Average 21.1% |
| Scandinavians | 45.2 /100 | #177 | Average 21.1% |
| Immigrants | Bosnia and Herzegovina | 44.9 /100 | #178 | Average 21.1% |
| British | 42.9 /100 | #179 | Average 21.1% |
| Spanish American Indians | 42.5 /100 | #180 | Average 21.1% |
| Europeans | 42.3 /100 | #181 | Average 21.1% |
| Slavs | 40.5 /100 | #182 | Average 21.1% |
| Slovaks | 39.7 /100 | #183 | Fair 21.1% |
| Hungarians | 39.6 /100 | #184 | Fair 21.1% |
Demographics Similar to Immigrants from Kuwait by Single Female Poverty
In terms of single female poverty, the demographic groups most similar to Immigrants from Kuwait are Slovene (20.3%, a difference of 0.010%), Syrian (20.3%, a difference of 0.010%), Immigrants from Nepal (20.3%, a difference of 0.040%), Immigrants from Canada (20.2%, a difference of 0.15%), and Immigrants from Iraq (20.2%, a difference of 0.16%).
| Demographics | Rating | Rank | Single Female Poverty |
| Uruguayans | 92.1 /100 | #132 | Exceptional 20.2% |
| Immigrants | England | 91.9 /100 | #133 | Exceptional 20.2% |
| Immigrants | Venezuela | 91.5 /100 | #134 | Exceptional 20.2% |
| Immigrants | Iraq | 91.2 /100 | #135 | Exceptional 20.2% |
| Immigrants | Canada | 91.2 /100 | #136 | Exceptional 20.2% |
| Immigrants | Nepal | 90.6 /100 | #137 | Exceptional 20.3% |
| Slovenes | 90.5 /100 | #138 | Exceptional 20.3% |
| Immigrants | Kuwait | 90.4 /100 | #139 | Exceptional 20.3% |
| Syrians | 90.4 /100 | #140 | Exceptional 20.3% |
| Immigrants | North America | 89.5 /100 | #141 | Excellent 20.3% |
| Immigrants | Uganda | 89.1 /100 | #142 | Excellent 20.3% |
| Australians | 88.4 /100 | #143 | Excellent 20.3% |
| Immigrants | Uzbekistan | 88.3 /100 | #144 | Excellent 20.3% |
| Austrians | 85.8 /100 | #145 | Excellent 20.4% |
| Venezuelans | 85.5 /100 | #146 | Excellent 20.4% |