Yugoslavian vs Immigrants from Uzbekistan Married-Couple Family Poverty
COMPARE
Yugoslavian
Immigrants from Uzbekistan
Married-Couple Family Poverty
Married-Couple Family Poverty Comparison
Yugoslavians
Immigrants from Uzbekistan
4.6%
MARRIED-COUPLE FAMILY POVERTY
97.8/ 100
METRIC RATING
101st/ 347
METRIC RANK
6.6%
MARRIED-COUPLE FAMILY POVERTY
0.0/ 100
METRIC RATING
295th/ 347
METRIC RANK
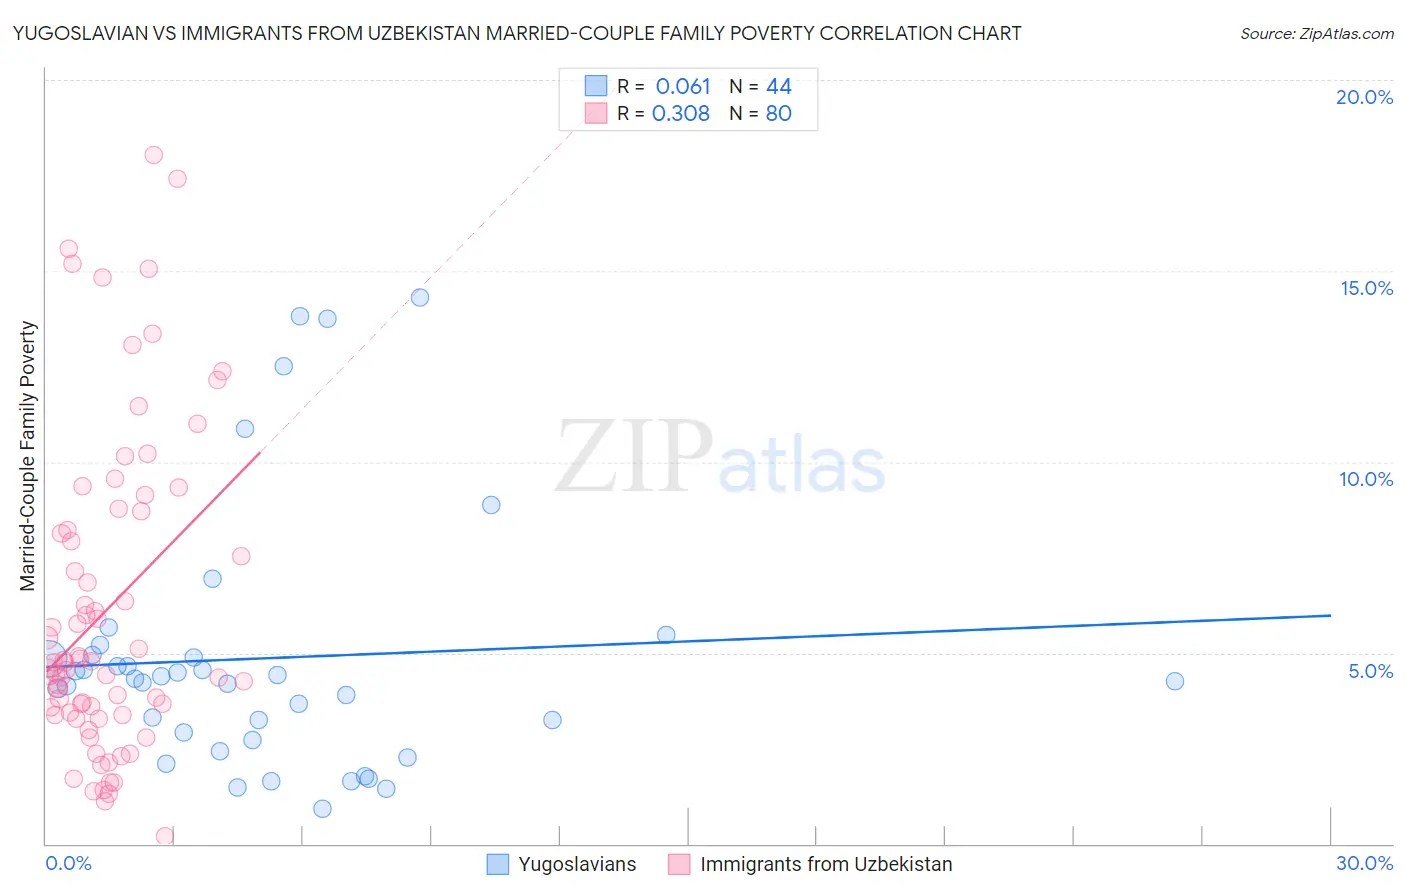
Yugoslavian vs Immigrants from Uzbekistan Married-Couple Family Poverty Correlation Chart
The statistical analysis conducted on geographies consisting of 284,040,939 people shows a slight positive correlation between the proportion of Yugoslavians and poverty level among married-couple families in the United States with a correlation coefficient (R) of 0.061 and weighted average of 4.6%. Similarly, the statistical analysis conducted on geographies consisting of 118,451,122 people shows a mild positive correlation between the proportion of Immigrants from Uzbekistan and poverty level among married-couple families in the United States with a correlation coefficient (R) of 0.308 and weighted average of 6.6%, a difference of 43.1%.
Married-Couple Family Poverty Correlation Summary
| Measurement | Yugoslavian | Immigrants from Uzbekistan |
| Minimum | 0.92% | 0.18% |
| Maximum | 14.3% | 18.0% |
| Range | 13.4% | 17.8% |
| Mean | 4.9% | 6.2% |
| Median | 4.3% | 4.7% |
| Interquartile 25% (IQ1) | 2.8% | 3.4% |
| Interquartile 75% (IQ3) | 4.9% | 8.5% |
| Interquartile Range (IQR) | 2.1% | 5.0% |
| Standard Deviation (Sample) | 3.4% | 4.1% |
| Standard Deviation (Population) | 3.3% | 4.1% |
Similar Demographics by Married-Couple Family Poverty
Demographics Similar to Yugoslavians by Married-Couple Family Poverty
In terms of married-couple family poverty, the demographic groups most similar to Yugoslavians are Immigrants from Western Europe (4.6%, a difference of 0.020%), Immigrants from Europe (4.6%, a difference of 0.13%), Native Hawaiian (4.6%, a difference of 0.24%), Asian (4.7%, a difference of 0.40%), and Immigrants from Belgium (4.6%, a difference of 0.67%).
| Demographics | Rating | Rank | Married-Couple Family Poverty |
| Immigrants | Italy | 98.3 /100 | #94 | Exceptional 4.6% |
| Portuguese | 98.3 /100 | #95 | Exceptional 4.6% |
| Immigrants | Poland | 98.3 /100 | #96 | Exceptional 4.6% |
| Immigrants | Belgium | 98.2 /100 | #97 | Exceptional 4.6% |
| Native Hawaiians | 98.0 /100 | #98 | Exceptional 4.6% |
| Immigrants | Europe | 97.9 /100 | #99 | Exceptional 4.6% |
| Immigrants | Western Europe | 97.9 /100 | #100 | Exceptional 4.6% |
| Yugoslavians | 97.8 /100 | #101 | Exceptional 4.6% |
| Asians | 97.6 /100 | #102 | Exceptional 4.7% |
| Immigrants | Romania | 97.3 /100 | #103 | Exceptional 4.7% |
| Immigrants | Moldova | 97.1 /100 | #104 | Exceptional 4.7% |
| Aleuts | 97.0 /100 | #105 | Exceptional 4.7% |
| Immigrants | France | 96.9 /100 | #106 | Exceptional 4.7% |
| Immigrants | Germany | 96.8 /100 | #107 | Exceptional 4.7% |
| Laotians | 96.6 /100 | #108 | Exceptional 4.7% |
Demographics Similar to Immigrants from Uzbekistan by Married-Couple Family Poverty
In terms of married-couple family poverty, the demographic groups most similar to Immigrants from Uzbekistan are U.S. Virgin Islander (6.6%, a difference of 0.10%), Kiowa (6.6%, a difference of 0.11%), Immigrants from Guyana (6.7%, a difference of 0.18%), Bahamian (6.6%, a difference of 0.29%), and Nicaraguan (6.7%, a difference of 0.73%).
| Demographics | Rating | Rank | Married-Couple Family Poverty |
| Salvadorans | 0.0 /100 | #288 | Tragic 6.5% |
| Nepalese | 0.0 /100 | #289 | Tragic 6.5% |
| Immigrants | Barbados | 0.0 /100 | #290 | Tragic 6.5% |
| Belizeans | 0.0 /100 | #291 | Tragic 6.5% |
| Immigrants | Lebanon | 0.0 /100 | #292 | Tragic 6.6% |
| Arapaho | 0.0 /100 | #293 | Tragic 6.6% |
| Bahamians | 0.0 /100 | #294 | Tragic 6.6% |
| Immigrants | Uzbekistan | 0.0 /100 | #295 | Tragic 6.6% |
| U.S. Virgin Islanders | 0.0 /100 | #296 | Tragic 6.6% |
| Kiowa | 0.0 /100 | #297 | Tragic 6.6% |
| Immigrants | Guyana | 0.0 /100 | #298 | Tragic 6.7% |
| Nicaraguans | 0.0 /100 | #299 | Tragic 6.7% |
| Immigrants | Belize | 0.0 /100 | #300 | Tragic 6.7% |
| Central Americans | 0.0 /100 | #301 | Tragic 6.7% |
| Immigrants | Ecuador | 0.0 /100 | #302 | Tragic 6.7% |