Slovak vs Immigrants from Uzbekistan Married-Couple Family Poverty
COMPARE
Slovak
Immigrants from Uzbekistan
Married-Couple Family Poverty
Married-Couple Family Poverty Comparison
Slovaks
Immigrants from Uzbekistan
4.0%
MARRIED-COUPLE FAMILY POVERTY
100.0/ 100
METRIC RATING
14th/ 347
METRIC RANK
6.6%
MARRIED-COUPLE FAMILY POVERTY
0.0/ 100
METRIC RATING
295th/ 347
METRIC RANK
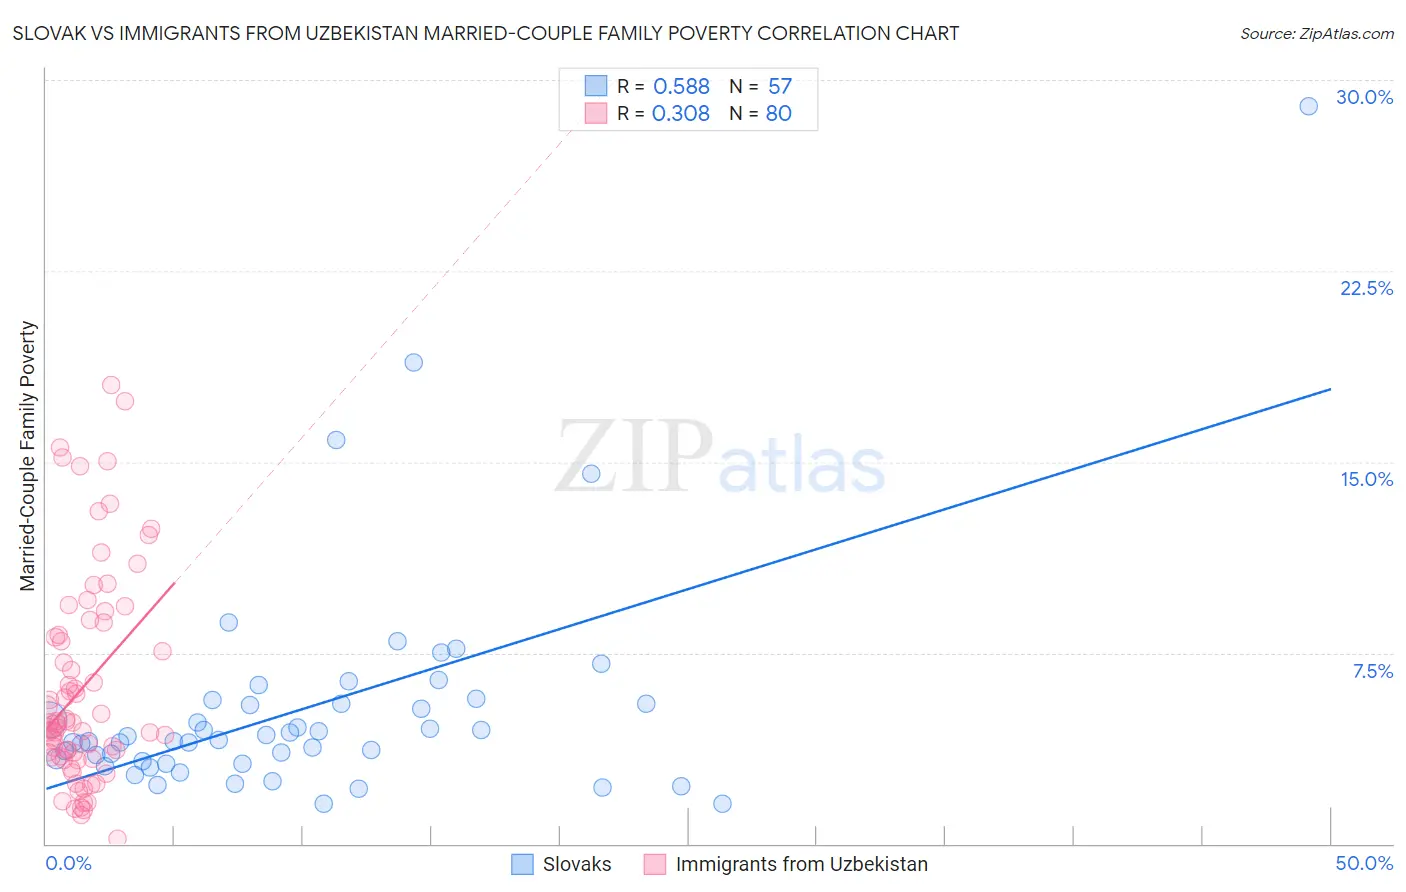
Slovak vs Immigrants from Uzbekistan Married-Couple Family Poverty Correlation Chart
The statistical analysis conducted on geographies consisting of 392,761,717 people shows a substantial positive correlation between the proportion of Slovaks and poverty level among married-couple families in the United States with a correlation coefficient (R) of 0.588 and weighted average of 4.0%. Similarly, the statistical analysis conducted on geographies consisting of 118,451,122 people shows a mild positive correlation between the proportion of Immigrants from Uzbekistan and poverty level among married-couple families in the United States with a correlation coefficient (R) of 0.308 and weighted average of 6.6%, a difference of 65.1%.
Married-Couple Family Poverty Correlation Summary
| Measurement | Slovak | Immigrants from Uzbekistan |
| Minimum | 1.6% | 0.18% |
| Maximum | 28.9% | 18.0% |
| Range | 27.4% | 17.8% |
| Mean | 5.4% | 6.2% |
| Median | 4.1% | 4.7% |
| Interquartile 25% (IQ1) | 3.2% | 3.4% |
| Interquartile 75% (IQ3) | 5.6% | 8.5% |
| Interquartile Range (IQR) | 2.4% | 5.0% |
| Standard Deviation (Sample) | 4.5% | 4.1% |
| Standard Deviation (Population) | 4.5% | 4.1% |
Similar Demographics by Married-Couple Family Poverty
Demographics Similar to Slovaks by Married-Couple Family Poverty
In terms of married-couple family poverty, the demographic groups most similar to Slovaks are Polish (4.0%, a difference of 0.030%), Czech (4.0%, a difference of 0.040%), German (4.0%, a difference of 0.30%), Filipino (4.0%, a difference of 0.33%), and Italian (4.0%, a difference of 0.34%).
| Demographics | Rating | Rank | Married-Couple Family Poverty |
| Latvians | 100.0 /100 | #7 | Exceptional 3.9% |
| Thais | 100.0 /100 | #8 | Exceptional 3.9% |
| Croatians | 100.0 /100 | #9 | Exceptional 3.9% |
| Carpatho Rusyns | 100.0 /100 | #10 | Exceptional 3.9% |
| Lithuanians | 100.0 /100 | #11 | Exceptional 4.0% |
| Bulgarians | 100.0 /100 | #12 | Exceptional 4.0% |
| Czechs | 100.0 /100 | #13 | Exceptional 4.0% |
| Slovaks | 100.0 /100 | #14 | Exceptional 4.0% |
| Poles | 100.0 /100 | #15 | Exceptional 4.0% |
| Germans | 100.0 /100 | #16 | Exceptional 4.0% |
| Filipinos | 100.0 /100 | #17 | Exceptional 4.0% |
| Italians | 100.0 /100 | #18 | Exceptional 4.0% |
| Immigrants | Ireland | 99.9 /100 | #19 | Exceptional 4.1% |
| Maltese | 99.9 /100 | #20 | Exceptional 4.1% |
| Zimbabweans | 99.9 /100 | #21 | Exceptional 4.1% |
Demographics Similar to Immigrants from Uzbekistan by Married-Couple Family Poverty
In terms of married-couple family poverty, the demographic groups most similar to Immigrants from Uzbekistan are U.S. Virgin Islander (6.6%, a difference of 0.10%), Kiowa (6.6%, a difference of 0.11%), Immigrants from Guyana (6.7%, a difference of 0.18%), Bahamian (6.6%, a difference of 0.29%), and Nicaraguan (6.7%, a difference of 0.73%).
| Demographics | Rating | Rank | Married-Couple Family Poverty |
| Salvadorans | 0.0 /100 | #288 | Tragic 6.5% |
| Nepalese | 0.0 /100 | #289 | Tragic 6.5% |
| Immigrants | Barbados | 0.0 /100 | #290 | Tragic 6.5% |
| Belizeans | 0.0 /100 | #291 | Tragic 6.5% |
| Immigrants | Lebanon | 0.0 /100 | #292 | Tragic 6.6% |
| Arapaho | 0.0 /100 | #293 | Tragic 6.6% |
| Bahamians | 0.0 /100 | #294 | Tragic 6.6% |
| Immigrants | Uzbekistan | 0.0 /100 | #295 | Tragic 6.6% |
| U.S. Virgin Islanders | 0.0 /100 | #296 | Tragic 6.6% |
| Kiowa | 0.0 /100 | #297 | Tragic 6.6% |
| Immigrants | Guyana | 0.0 /100 | #298 | Tragic 6.7% |
| Nicaraguans | 0.0 /100 | #299 | Tragic 6.7% |
| Immigrants | Belize | 0.0 /100 | #300 | Tragic 6.7% |
| Central Americans | 0.0 /100 | #301 | Tragic 6.7% |
| Immigrants | Ecuador | 0.0 /100 | #302 | Tragic 6.7% |