Yaqui vs South African Female Poverty

COMPARE

Yaqui
Race
Ancestry
AfghanAfricanAlaska NativeAlaskan AthabascanAlbanianAleutAlsatianAmericanApacheArabArapahoArgentineanArmenianAssyrian/Chaldean/SyriacAustralianAustrianBahamianBangladeshiBarbadianBasqueBelgianBelizeanBermudanBhutaneseBlackfeetBolivianBrazilianBritishBritish West IndianBulgarianBurmeseCajunCambodianCanadianCape VerdeanCarpatho RusynCelticCentral AmericanCentral American IndianCherokeeCheyenneChickasawChileanChineseChippewaChoctawColombianColvilleComancheCosta RicanCreeCreekCroatianCrowCubanCypriotCzechCzechoslovakianDanishDelawareDominicanDutchDutch West IndianEastern EuropeanEcuadorianEgyptianEnglishEstonianEthiopianEuropeanFijianFilipinoFinnishFrenchFrench American IndianFrench CanadianGermanGerman RussianGhanaianGreekGuamanian/ChamorroGuatemalanGuyaneseHaitianHmongHonduranHopiHoumaHungarianIcelanderIndian (Asian)IndonesianInupiatIranianIraqiIrishIroquoisIsraeliItalianJamaicanJapaneseJordanianKenyanKiowaKoreanLaotianLatvianLebaneseLiberianLithuanianLumbeeLuxembourgerMacedonianMalaysianMalteseMarshalleseMenomineeMexicanMexican American IndianMongolianMoroccanNative HawaiianNavajoNepaleseNew ZealanderNicaraguanNigerianNorthern EuropeanNorwegianOkinawanOsageOttawaPaiutePakistaniPalestinianPanamanianParaguayanPennsylvania GermanPeruvianPimaPolishPortuguesePotawatomiPuebloPuerto RicanPuget Sound SalishRomanianRussianSalvadoranSamoanScandinavianScotch-IrishScottishSeminoleSenegaleseSerbianShoshoneSierra LeoneanSiouxSlavicSlovakSloveneSomaliSouth AmericanSouth American IndianSoviet UnionSpaniardSpanishSpanish AmericanSpanish American IndianSri LankanSubsaharan AfricanSudaneseSwedishSwissSyrianTaiwaneseThaiTlingit-HaidaTohono O'OdhamTonganTrinidadian and TobagonianTsimshianTurkishU.S. Virgin IslanderUgandanUkrainianUruguayanUteVenezuelanVietnameseWelshWest IndianYakamaYaquiYugoslavianYumanYup'ikZimbabwean
Immigration
NonimmigrantsImmigrantsAfghanistanAfricaAlbaniaArgentinaArmeniaAsiaAustraliaAustriaBahamasBangladeshBarbadosBelarusBelgiumBelizeBoliviaBosnia and HerzegovinaBrazilBulgariaBurma/MyanmarCabo VerdeCambodiaCameroonCanadaCaribbeanCentral AmericaChileChinaColombiaCongoCosta RicaCroatiaCubaCzechoslovakiaDenmarkDominicaDominican RepublicEastern AfricaEastern AsiaEastern EuropeEcuadorEgyptEl SalvadorEnglandEritreaEthiopiaEuropeFijiFranceGermanyGhanaGreeceGrenadaGuatemalaGuyanaHaitiHondurasHong KongHungaryIndiaIndonesiaIranIraqIrelandIsraelItalyJamaicaJapanJordanKazakhstanKenyaKoreaKuwaitLaosLatin AmericaLatviaLebanonLiberiaLithuaniaMalaysiaMexicoMicronesiaMiddle AfricaMoldovaMoroccoNepalNetherlandsNicaraguaNigeriaNorth AmericaNorth MacedoniaNorthern AfricaNorthern EuropeNorwayOceaniaPakistanPanamaPeruPhilippinesPolandPortugalRomaniaRussiaSaudi ArabiaScotlandSenegalSerbiaSierra LeoneSingaporeSomaliaSouth AfricaSouth AmericaSouth Central AsiaSouth Eastern AsiaSouthern EuropeSpainSri LankaSt. Vincent and the GrenadinesSudanSwedenSwitzerlandSyriaTaiwanThailandTrinidad and TobagoTurkeyUgandaUkraineUruguayUzbekistanVenezuelaVietnamWest IndiesWestern AfricaWestern AsiaWestern EuropeYemenZaireZimbabweAzores
South African
Race
Ancestry
AfghanAfricanAlaska NativeAlaskan AthabascanAlbanianAleutAlsatianAmericanApacheArabArapahoArgentineanArmenianAssyrian/Chaldean/SyriacAustralianAustrianBahamianBangladeshiBarbadianBasqueBelgianBelizeanBermudanBhutaneseBlackfeetBolivianBrazilianBritishBritish West IndianBulgarianBurmeseCajunCambodianCanadianCape VerdeanCarpatho RusynCelticCentral AmericanCentral American IndianCherokeeCheyenneChickasawChileanChineseChippewaChoctawColombianColvilleComancheCosta RicanCreeCreekCroatianCrowCubanCypriotCzechCzechoslovakianDanishDelawareDominicanDutchDutch West IndianEastern EuropeanEcuadorianEgyptianEnglishEstonianEthiopianEuropeanFijianFilipinoFinnishFrenchFrench American IndianFrench CanadianGermanGerman RussianGhanaianGreekGuamanian/ChamorroGuatemalanGuyaneseHaitianHmongHonduranHopiHoumaHungarianIcelanderIndian (Asian)IndonesianInupiatIranianIraqiIrishIroquoisIsraeliItalianJamaicanJapaneseJordanianKenyanKiowaKoreanLaotianLatvianLebaneseLiberianLithuanianLumbeeLuxembourgerMacedonianMalaysianMalteseMarshalleseMenomineeMexicanMexican American IndianMongolianMoroccanNative HawaiianNavajoNepaleseNew ZealanderNicaraguanNigerianNorthern EuropeanNorwegianOkinawanOsageOttawaPaiutePakistaniPalestinianPanamanianParaguayanPennsylvania GermanPeruvianPimaPolishPortuguesePotawatomiPuebloPuerto RicanPuget Sound SalishRomanianRussianSalvadoranSamoanScandinavianScotch-IrishScottishSeminoleSenegaleseSerbianShoshoneSierra LeoneanSiouxSlavicSlovakSloveneSomaliSouth AfricanSouth AmericanSouth American IndianSoviet UnionSpaniardSpanishSpanish AmericanSpanish American IndianSri LankanSubsaharan AfricanSudaneseSwedishSwissSyrianTaiwaneseThaiTlingit-HaidaTohono O'OdhamTonganTrinidadian and TobagonianTsimshianTurkishU.S. Virgin IslanderUgandanUkrainianUruguayanUteVenezuelanVietnameseWelshWest IndianYakamaYugoslavianYumanYup'ikZimbabwean
Immigration
NonimmigrantsImmigrantsAfghanistanAfricaAlbaniaArgentinaArmeniaAsiaAustraliaAustriaBahamasBangladeshBarbadosBelarusBelgiumBelizeBoliviaBosnia and HerzegovinaBrazilBulgariaBurma/MyanmarCabo VerdeCambodiaCameroonCanadaCaribbeanCentral AmericaChileChinaColombiaCongoCosta RicaCroatiaCubaCzechoslovakiaDenmarkDominicaDominican RepublicEastern AfricaEastern AsiaEastern EuropeEcuadorEgyptEl SalvadorEnglandEritreaEthiopiaEuropeFijiFranceGermanyGhanaGreeceGrenadaGuatemalaGuyanaHaitiHondurasHong KongHungaryIndiaIndonesiaIranIraqIrelandIsraelItalyJamaicaJapanJordanKazakhstanKenyaKoreaKuwaitLaosLatin AmericaLatviaLebanonLiberiaLithuaniaMalaysiaMexicoMicronesiaMiddle AfricaMoldovaMoroccoNepalNetherlandsNicaraguaNigeriaNorth AmericaNorth MacedoniaNorthern AfricaNorthern EuropeNorwayOceaniaPakistanPanamaPeruPhilippinesPolandPortugalRomaniaRussiaSaudi ArabiaScotlandSenegalSerbiaSierra LeoneSingaporeSomaliaSouth AfricaSouth AmericaSouth Central AsiaSouth Eastern AsiaSouthern EuropeSpainSri LankaSt. Vincent and the GrenadinesSudanSwedenSwitzerlandSyriaTaiwanThailandTrinidad and TobagoTurkeyUgandaUkraineUruguayUzbekistanVenezuelaVietnamWest IndiesWestern AfricaWestern AsiaWestern EuropeYemenZaireZimbabweAzores
Female Poverty
Income
Poverty
Unemployment
Labor Participation
Family Structure
Vehicle Availability
Education Level
Disability

Female Poverty Comparison

Yaqui

South Africans

Tragic
Excellent
16.4%
FEMALE POVERTY
0.0/ 100
METRIC RATING
291st/ 347
METRIC RANK
12.8%
FEMALE POVERTY
88.4/ 100
METRIC RATING
127th/ 347
METRIC RANK

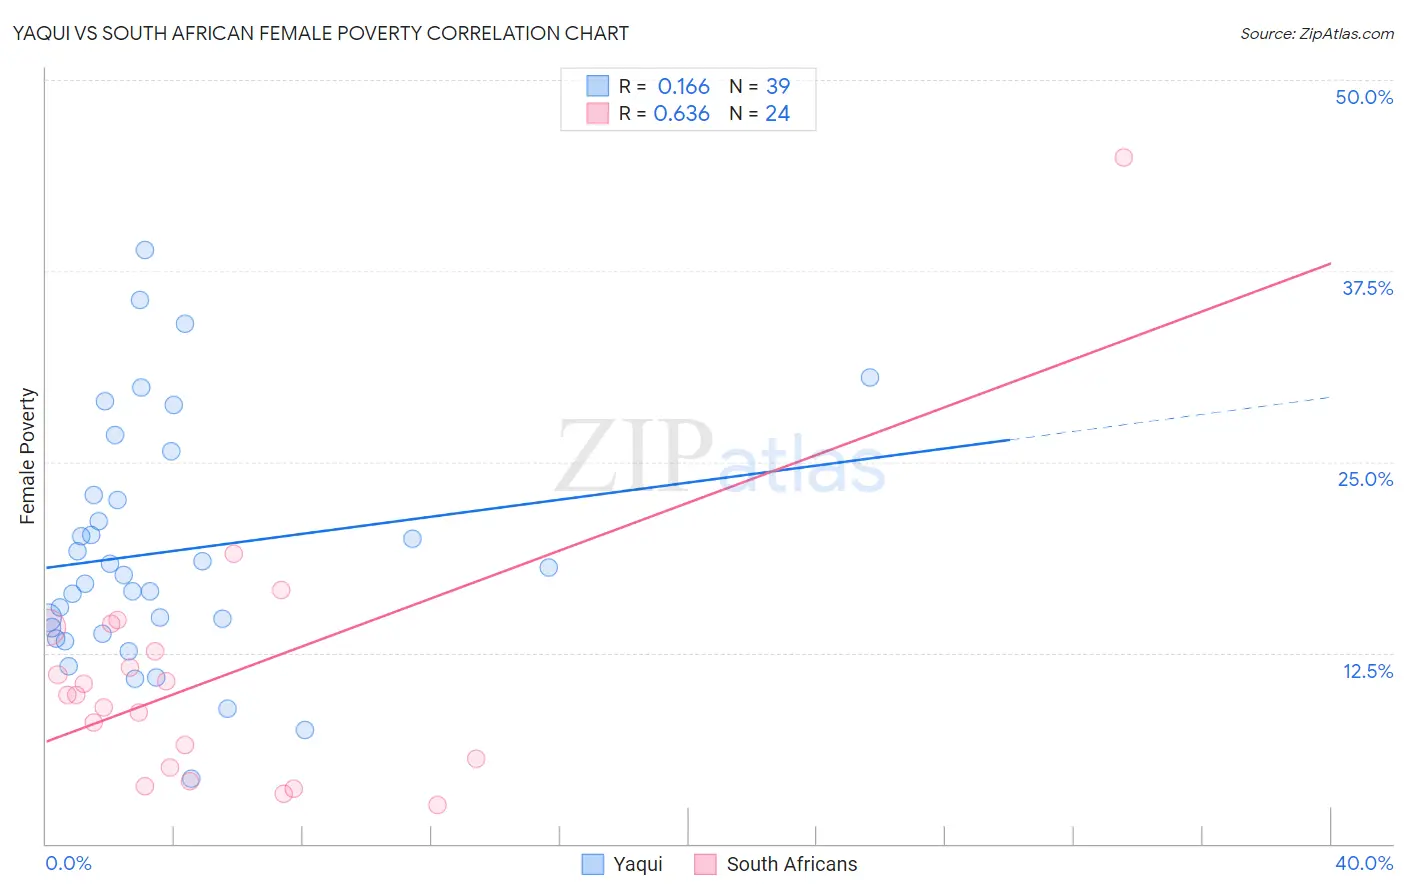
Yaqui vs South African Female Poverty Correlation Chart

The statistical analysis conducted on geographies consisting of 107,715,533 people shows a poor positive correlation between the proportion of Yaqui and poverty level among females in the United States with a correlation coefficient (R) of 0.166 and weighted average of 16.4%. Similarly, the statistical analysis conducted on geographies consisting of 182,540,648 people shows a significant positive correlation between the proportion of South Africans and poverty level among females in the United States with a correlation coefficient (R) of 0.636 and weighted average of 12.8%, a difference of 28.4%.
Yaqui vs South African Female Poverty

Female Poverty Correlation Summary

MeasurementYaquiSouth African
Minimum4.2%2.6%
Maximum38.9%44.9%
Range34.7%42.4%
Mean19.1%10.8%
Median17.6%9.7%
Interquartile 25% (IQ1)13.7%5.3%
Interquartile 75% (IQ3)22.9%13.4%
Interquartile Range (IQR)9.1%8.1%
Standard Deviation (Sample)7.9%8.5%
Standard Deviation (Population)7.8%8.4%

Similar Demographics by Female Poverty

Demographics Similar to Yaqui by Female Poverty

In terms of female poverty, the demographic groups most similar to Yaqui are Immigrants from Zaire (16.4%, a difference of 0.010%), Immigrants from Latin America (16.4%, a difference of 0.070%), Immigrants from Cabo Verde (16.4%, a difference of 0.10%), Immigrants from Bangladesh (16.4%, a difference of 0.17%), and Senegalese (16.5%, a difference of 0.18%).
DemographicsRating | RankFemale Poverty
Spanish Americans
0.0
/100
|
#284
Tragic
16.2%
Comanche
0.0
/100
|
#285
Tragic
16.2%
Inupiat
0.0
/100
|
#286
Tragic
16.2%
Immigrants | Belize
0.0
/100
|
#287
Tragic
16.3%
Indonesians
0.0
/100
|
#288
Tragic
16.4%
Blackfeet
0.0
/100
|
#289
Tragic
16.4%
Immigrants | Bangladesh
0.0
/100
|
#290
Tragic
16.4%
Yaqui
0.0
/100
|
#291
Tragic
16.4%
Immigrants | Zaire
0.0
/100
|
#292
Tragic
16.4%
Immigrants | Latin America
0.0
/100
|
#293
Tragic
16.4%
Immigrants | Cabo Verde
0.0
/100
|
#294
Tragic
16.4%
Senegalese
0.0
/100
|
#295
Tragic
16.5%
Immigrants | Senegal
0.0
/100
|
#296
Tragic
16.5%
Mexicans
0.0
/100
|
#297
Tragic
16.5%
Somalis
0.0
/100
|
#298
Tragic
16.6%

Demographics Similar to South Africans by Female Poverty

In terms of female poverty, the demographic groups most similar to South Africans are Immigrants from Belarus (12.8%, a difference of 0.040%), Immigrants from Ukraine (12.8%, a difference of 0.11%), Immigrants from Brazil (12.8%, a difference of 0.11%), Argentinean (12.8%, a difference of 0.18%), and Immigrants from Norway (12.8%, a difference of 0.23%).
DemographicsRating | RankFemale Poverty
New Zealanders
90.6
/100
|
#120
Exceptional
12.7%
Immigrants | Hungary
90.3
/100
|
#121
Exceptional
12.7%
French Canadians
90.2
/100
|
#122
Exceptional
12.7%
Immigrants | South Eastern Asia
89.9
/100
|
#123
Excellent
12.7%
Immigrants | Norway
89.3
/100
|
#124
Excellent
12.8%
Argentineans
89.1
/100
|
#125
Excellent
12.8%
Immigrants | Ukraine
88.8
/100
|
#126
Excellent
12.8%
South Africans
88.4
/100
|
#127
Excellent
12.8%
Immigrants | Belarus
88.2
/100
|
#128
Excellent
12.8%
Immigrants | Brazil
87.9
/100
|
#129
Excellent
12.8%
Immigrants | Vietnam
87.1
/100
|
#130
Excellent
12.8%
Immigrants | Argentina
87.0
/100
|
#131
Excellent
12.8%
Immigrants | Jordan
86.9
/100
|
#132
Excellent
12.8%
Immigrants | Western Europe
86.6
/100
|
#133
Excellent
12.8%
Immigrants | Switzerland
85.8
/100
|
#134
Excellent
12.9%