Yakama vs Colombian Single Male Poverty
COMPARE
Yakama
Colombian
Single Male Poverty
Single Male Poverty Comparison
Yakama
Colombians
15.9%
SINGLE MALE POVERTY
0.0/ 100
METRIC RATING
310th/ 347
METRIC RANK
12.2%
SINGLE MALE POVERTY
97.8/ 100
METRIC RATING
94th/ 347
METRIC RANK
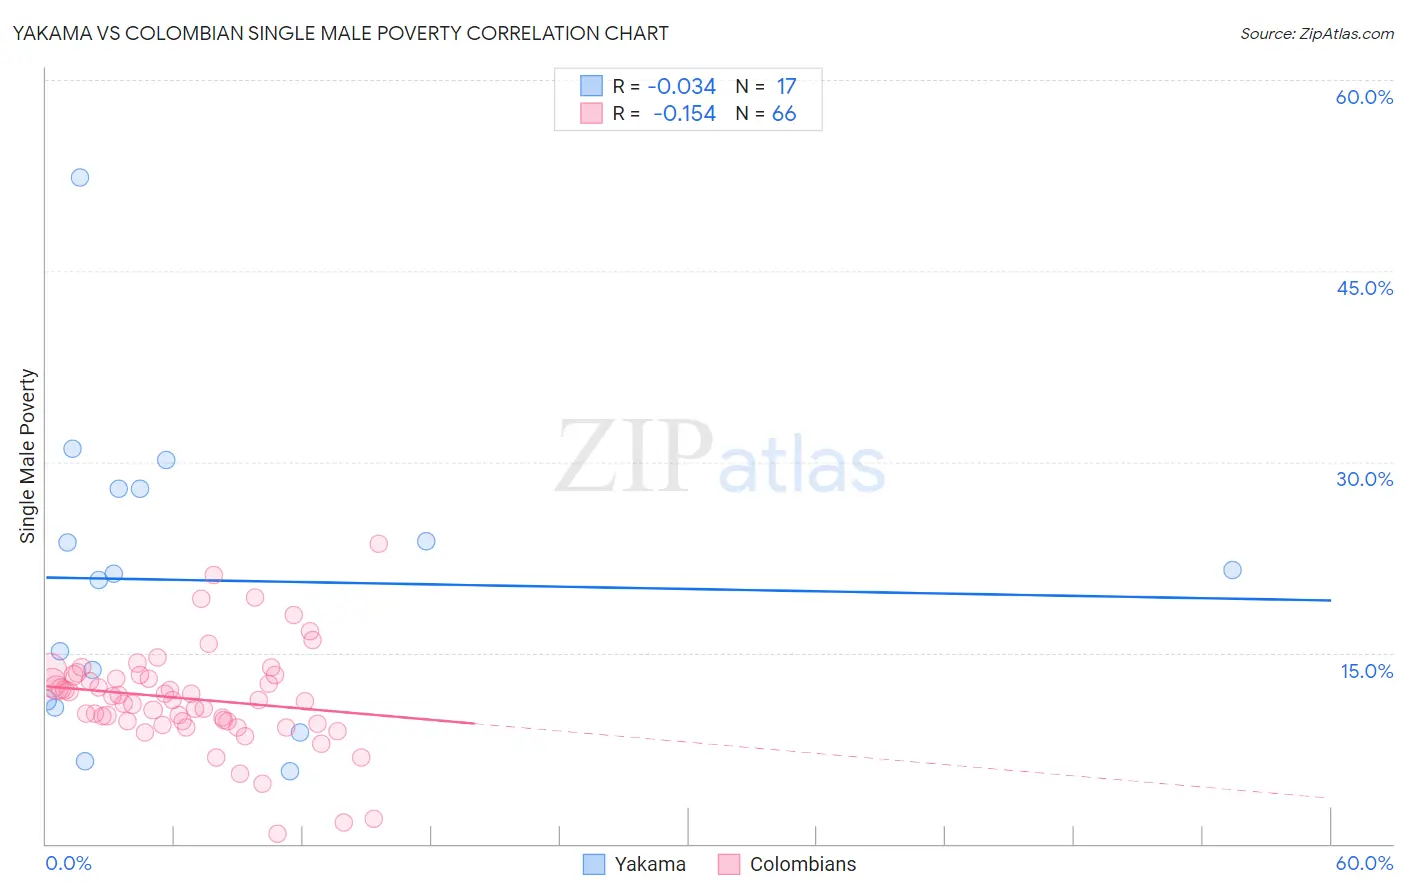
Yakama vs Colombian Single Male Poverty Correlation Chart
The statistical analysis conducted on geographies consisting of 19,068,599 people shows no correlation between the proportion of Yakama and poverty level among single males in the United States with a correlation coefficient (R) of -0.034 and weighted average of 15.9%. Similarly, the statistical analysis conducted on geographies consisting of 370,615,335 people shows a poor negative correlation between the proportion of Colombians and poverty level among single males in the United States with a correlation coefficient (R) of -0.154 and weighted average of 12.2%, a difference of 31.0%.
Single Male Poverty Correlation Summary
| Measurement | Yakama | Colombian |
| Minimum | 5.7% | 0.77% |
| Maximum | 52.4% | 23.6% |
| Range | 46.7% | 22.8% |
| Mean | 20.7% | 11.4% |
| Median | 21.2% | 11.3% |
| Interquartile 25% (IQ1) | 11.0% | 9.6% |
| Interquartile 75% (IQ3) | 27.9% | 13.2% |
| Interquartile Range (IQR) | 16.9% | 3.6% |
| Standard Deviation (Sample) | 11.6% | 4.0% |
| Standard Deviation (Population) | 11.3% | 4.0% |
Similar Demographics by Single Male Poverty
Demographics Similar to Yakama by Single Male Poverty
In terms of single male poverty, the demographic groups most similar to Yakama are Seminole (16.0%, a difference of 0.54%), Comanche (16.0%, a difference of 0.54%), Cherokee (16.1%, a difference of 0.77%), American (15.8%, a difference of 0.87%), and Potawatomi (15.8%, a difference of 1.0%).
| Demographics | Rating | Rank | Single Male Poverty |
| Aleuts | 0.0 /100 | #303 | Tragic 15.4% |
| Alaska Natives | 0.0 /100 | #304 | Tragic 15.4% |
| Blackfeet | 0.0 /100 | #305 | Tragic 15.5% |
| Pennsylvania Germans | 0.0 /100 | #306 | Tragic 15.6% |
| Ute | 0.0 /100 | #307 | Tragic 15.7% |
| Potawatomi | 0.0 /100 | #308 | Tragic 15.8% |
| Americans | 0.0 /100 | #309 | Tragic 15.8% |
| Yakama | 0.0 /100 | #310 | Tragic 15.9% |
| Seminole | 0.0 /100 | #311 | Tragic 16.0% |
| Comanche | 0.0 /100 | #312 | Tragic 16.0% |
| Cherokee | 0.0 /100 | #313 | Tragic 16.1% |
| Alaskan Athabascans | 0.0 /100 | #314 | Tragic 16.1% |
| Cheyenne | 0.0 /100 | #315 | Tragic 16.1% |
| Dutch West Indians | 0.0 /100 | #316 | Tragic 16.1% |
| Blacks/African Americans | 0.0 /100 | #317 | Tragic 16.2% |
Demographics Similar to Colombians by Single Male Poverty
In terms of single male poverty, the demographic groups most similar to Colombians are Mongolian (12.2%, a difference of 0.010%), Immigrants from Bosnia and Herzegovina (12.1%, a difference of 0.12%), Immigrants from Sweden (12.2%, a difference of 0.16%), Spanish American Indian (12.1%, a difference of 0.18%), and Immigrants from Italy (12.2%, a difference of 0.21%).
| Demographics | Rating | Rank | Single Male Poverty |
| South Americans | 98.5 /100 | #87 | Exceptional 12.1% |
| Immigrants | Eritrea | 98.5 /100 | #88 | Exceptional 12.1% |
| Immigrants | Ireland | 98.3 /100 | #89 | Exceptional 12.1% |
| South American Indians | 98.3 /100 | #90 | Exceptional 12.1% |
| Immigrants | Turkey | 98.2 /100 | #91 | Exceptional 12.1% |
| Spanish American Indians | 98.0 /100 | #92 | Exceptional 12.1% |
| Immigrants | Bosnia and Herzegovina | 97.9 /100 | #93 | Exceptional 12.1% |
| Colombians | 97.8 /100 | #94 | Exceptional 12.2% |
| Mongolians | 97.7 /100 | #95 | Exceptional 12.2% |
| Immigrants | Sweden | 97.5 /100 | #96 | Exceptional 12.2% |
| Immigrants | Italy | 97.4 /100 | #97 | Exceptional 12.2% |
| Guamanians/Chamorros | 97.4 /100 | #98 | Exceptional 12.2% |
| Immigrants | Cuba | 97.3 /100 | #99 | Exceptional 12.2% |
| Immigrants | Australia | 97.1 /100 | #100 | Exceptional 12.2% |
| Immigrants | Latvia | 97.0 /100 | #101 | Exceptional 12.2% |