Yakama vs Colombian Hearing Disability
COMPARE
Yakama
Colombian
Hearing Disability
Hearing Disability Comparison
Yakama
Colombians
3.9%
HEARING DISABILITY
0.0/ 100
METRIC RATING
314th/ 347
METRIC RANK
2.7%
HEARING DISABILITY
97.4/ 100
METRIC RATING
79th/ 347
METRIC RANK
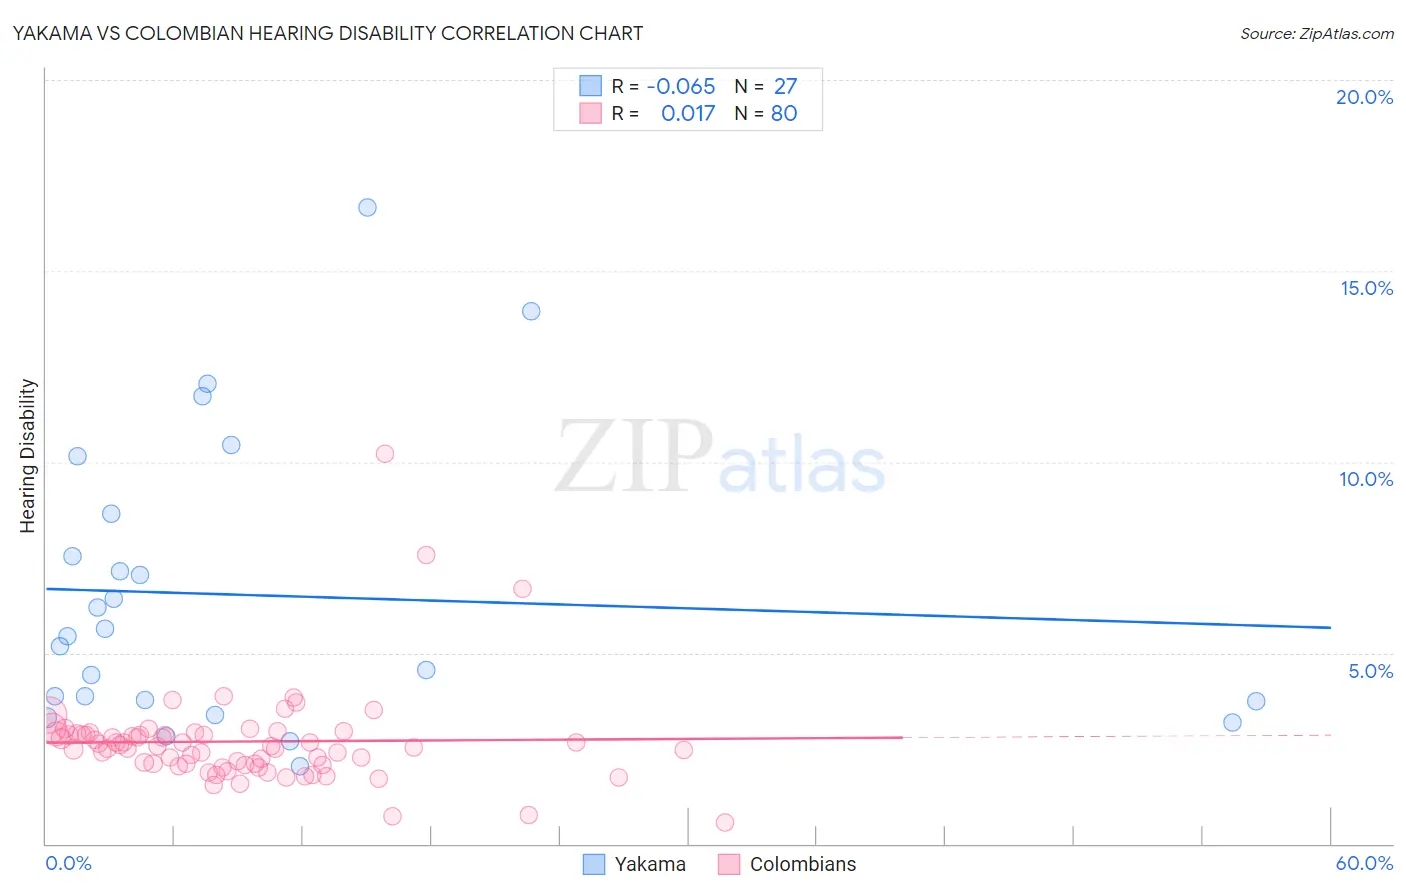
Yakama vs Colombian Hearing Disability Correlation Chart
The statistical analysis conducted on geographies consisting of 19,917,800 people shows a slight negative correlation between the proportion of Yakama and percentage of population with hearing disability in the United States with a correlation coefficient (R) of -0.065 and weighted average of 3.9%. Similarly, the statistical analysis conducted on geographies consisting of 419,423,725 people shows no correlation between the proportion of Colombians and percentage of population with hearing disability in the United States with a correlation coefficient (R) of 0.017 and weighted average of 2.7%, a difference of 44.1%.
Hearing Disability Correlation Summary
| Measurement | Yakama | Colombian |
| Minimum | 2.0% | 0.57% |
| Maximum | 16.7% | 10.2% |
| Range | 14.6% | 9.7% |
| Mean | 6.5% | 2.7% |
| Median | 5.4% | 2.6% |
| Interquartile 25% (IQ1) | 3.7% | 2.1% |
| Interquartile 75% (IQ3) | 8.6% | 2.9% |
| Interquartile Range (IQR) | 4.9% | 0.79% |
| Standard Deviation (Sample) | 3.8% | 1.3% |
| Standard Deviation (Population) | 3.7% | 1.3% |
Similar Demographics by Hearing Disability
Demographics Similar to Yakama by Hearing Disability
In terms of hearing disability, the demographic groups most similar to Yakama are Puget Sound Salish (3.9%, a difference of 0.010%), Hopi (3.9%, a difference of 0.17%), Spanish American (4.0%, a difference of 0.21%), Cajun (3.9%, a difference of 0.28%), and Comanche (4.0%, a difference of 0.34%).
| Demographics | Rating | Rank | Hearing Disability |
| French Canadians | 0.0 /100 | #307 | Tragic 3.8% |
| Ottawa | 0.0 /100 | #308 | Tragic 3.8% |
| Scotch-Irish | 0.0 /100 | #309 | Tragic 3.8% |
| Cree | 0.0 /100 | #310 | Tragic 3.8% |
| Americans | 0.0 /100 | #311 | Tragic 3.9% |
| Cajuns | 0.0 /100 | #312 | Tragic 3.9% |
| Hopi | 0.0 /100 | #313 | Tragic 3.9% |
| Yakama | 0.0 /100 | #314 | Tragic 3.9% |
| Puget Sound Salish | 0.0 /100 | #315 | Tragic 3.9% |
| Spanish Americans | 0.0 /100 | #316 | Tragic 4.0% |
| Comanche | 0.0 /100 | #317 | Tragic 4.0% |
| Cheyenne | 0.0 /100 | #318 | Tragic 4.0% |
| Chippewa | 0.0 /100 | #319 | Tragic 4.0% |
| Shoshone | 0.0 /100 | #320 | Tragic 4.0% |
| Paiute | 0.0 /100 | #321 | Tragic 4.1% |
Demographics Similar to Colombians by Hearing Disability
In terms of hearing disability, the demographic groups most similar to Colombians are Mongolian (2.7%, a difference of 0.020%), Immigrants from Malaysia (2.7%, a difference of 0.060%), Asian (2.7%, a difference of 0.080%), Immigrants from Saudi Arabia (2.7%, a difference of 0.090%), and Immigrants from Korea (2.7%, a difference of 0.11%).
| Demographics | Rating | Rank | Hearing Disability |
| Afghans | 97.6 /100 | #72 | Exceptional 2.7% |
| Argentineans | 97.5 /100 | #73 | Exceptional 2.7% |
| Immigrants | Korea | 97.5 /100 | #74 | Exceptional 2.7% |
| Immigrants | Saudi Arabia | 97.5 /100 | #75 | Exceptional 2.7% |
| Asians | 97.5 /100 | #76 | Exceptional 2.7% |
| Immigrants | Malaysia | 97.5 /100 | #77 | Exceptional 2.7% |
| Mongolians | 97.4 /100 | #78 | Exceptional 2.7% |
| Colombians | 97.4 /100 | #79 | Exceptional 2.7% |
| Immigrants | Asia | 97.2 /100 | #80 | Exceptional 2.7% |
| Immigrants | Uruguay | 97.2 /100 | #81 | Exceptional 2.7% |
| Immigrants | Armenia | 97.2 /100 | #82 | Exceptional 2.7% |
| Immigrants | Cuba | 97.2 /100 | #83 | Exceptional 2.7% |
| Immigrants | Argentina | 97.0 /100 | #84 | Exceptional 2.8% |
| Immigrants | Northern Africa | 96.9 /100 | #85 | Exceptional 2.8% |
| Immigrants | Iran | 96.8 /100 | #86 | Exceptional 2.8% |