Yakama vs Colombian Receiving Food Stamps
COMPARE
Yakama
Colombian
Receiving Food Stamps
Receiving Food Stamps Comparison
Yakama
Colombians
21.4%
RECEIVING FOOD STAMPS
0.0/ 100
METRIC RATING
339th/ 347
METRIC RANK
12.6%
RECEIVING FOOD STAMPS
10.2/ 100
METRIC RATING
211th/ 347
METRIC RANK
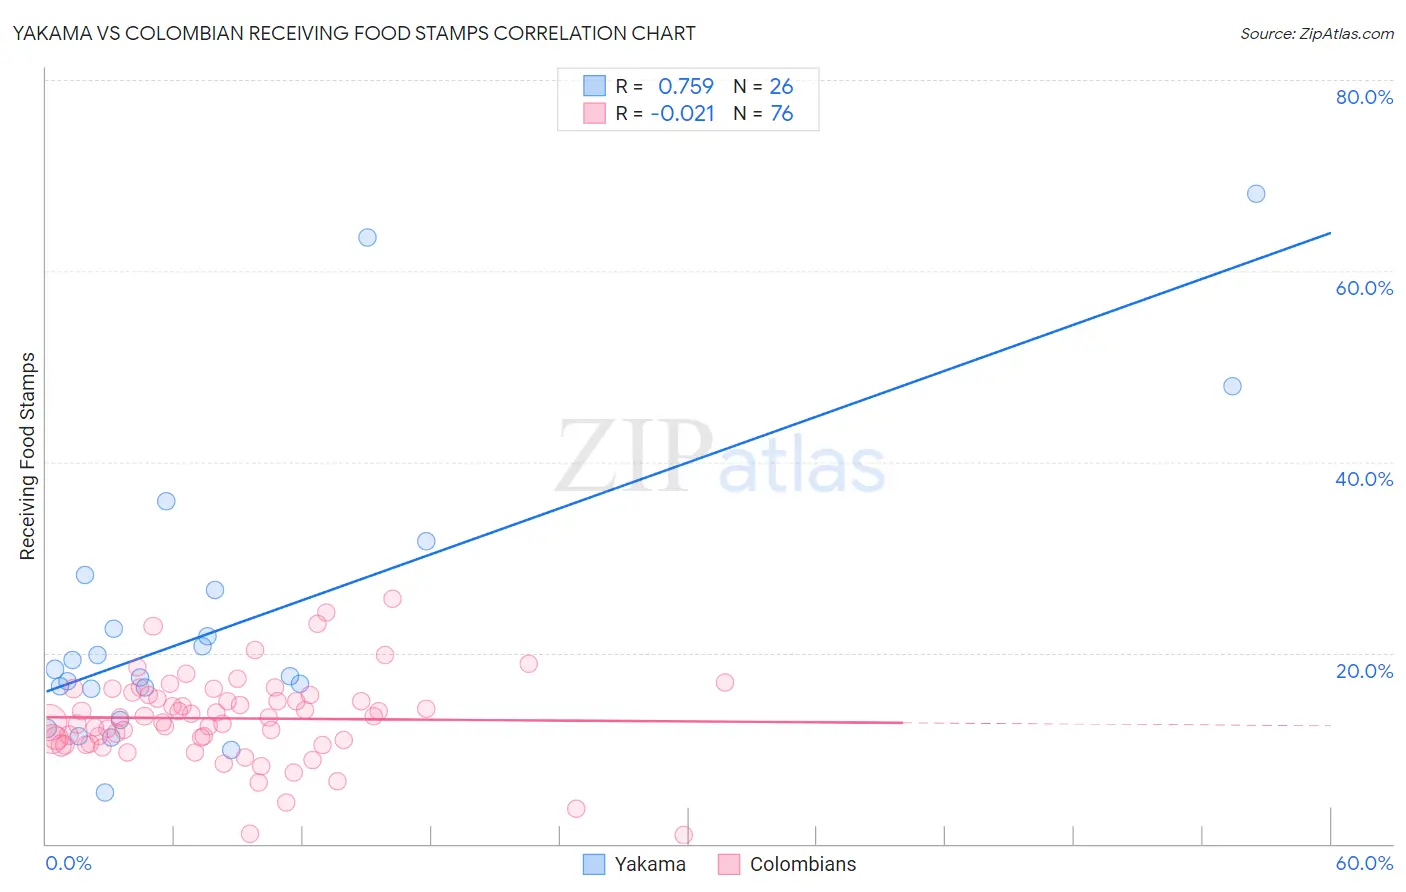
Yakama vs Colombian Receiving Food Stamps Correlation Chart
The statistical analysis conducted on geographies consisting of 19,916,824 people shows a strong positive correlation between the proportion of Yakama and percentage of population receiving government assistance and/or food stamps in the United States with a correlation coefficient (R) of 0.759 and weighted average of 21.4%. Similarly, the statistical analysis conducted on geographies consisting of 418,206,966 people shows no correlation between the proportion of Colombians and percentage of population receiving government assistance and/or food stamps in the United States with a correlation coefficient (R) of -0.021 and weighted average of 12.6%, a difference of 69.6%.
Receiving Food Stamps Correlation Summary
| Measurement | Yakama | Colombian |
| Minimum | 5.4% | 0.90% |
| Maximum | 68.1% | 25.6% |
| Range | 62.7% | 24.7% |
| Mean | 23.3% | 13.1% |
| Median | 17.9% | 13.3% |
| Interquartile 25% (IQ1) | 16.3% | 10.7% |
| Interquartile 75% (IQ3) | 26.6% | 15.5% |
| Interquartile Range (IQR) | 10.3% | 4.8% |
| Standard Deviation (Sample) | 15.3% | 4.6% |
| Standard Deviation (Population) | 15.0% | 4.5% |
Similar Demographics by Receiving Food Stamps
Demographics Similar to Yakama by Receiving Food Stamps
In terms of receiving food stamps, the demographic groups most similar to Yakama are Dominican (21.4%, a difference of 0.26%), Tohono O'odham (21.5%, a difference of 0.26%), Hopi (21.6%, a difference of 0.63%), Immigrants from Yemen (21.6%, a difference of 1.0%), and Cape Verdean (21.1%, a difference of 1.7%).
| Demographics | Rating | Rank | Receiving Food Stamps |
| Pueblo | 0.0 /100 | #332 | Tragic 19.9% |
| Inupiat | 0.0 /100 | #333 | Tragic 20.1% |
| Yuman | 0.0 /100 | #334 | Tragic 20.2% |
| Immigrants | Cuba | 0.0 /100 | #335 | Tragic 20.8% |
| Navajo | 0.0 /100 | #336 | Tragic 21.1% |
| Cape Verdeans | 0.0 /100 | #337 | Tragic 21.1% |
| Dominicans | 0.0 /100 | #338 | Tragic 21.4% |
| Yakama | 0.0 /100 | #339 | Tragic 21.4% |
| Tohono O'odham | 0.0 /100 | #340 | Tragic 21.5% |
| Hopi | 0.0 /100 | #341 | Tragic 21.6% |
| Immigrants | Yemen | 0.0 /100 | #342 | Tragic 21.6% |
| Immigrants | Dominican Republic | 0.0 /100 | #343 | Tragic 22.1% |
| Lumbee | 0.0 /100 | #344 | Tragic 22.9% |
| Immigrants | Cabo Verde | 0.0 /100 | #345 | Tragic 23.8% |
| Puerto Ricans | 0.0 /100 | #346 | Tragic 26.0% |
Demographics Similar to Colombians by Receiving Food Stamps
In terms of receiving food stamps, the demographic groups most similar to Colombians are Malaysian (12.7%, a difference of 0.63%), Immigrants from Uruguay (12.5%, a difference of 0.83%), Immigrants from Sierra Leone (12.5%, a difference of 0.86%), Moroccan (12.8%, a difference of 1.0%), and Immigrants from Africa (12.8%, a difference of 1.1%).
| Demographics | Rating | Rank | Receiving Food Stamps |
| Immigrants | Nonimmigrants | 17.6 /100 | #204 | Poor 12.4% |
| Aleuts | 17.3 /100 | #205 | Poor 12.4% |
| Immigrants | Thailand | 17.0 /100 | #206 | Poor 12.4% |
| South Americans | 16.0 /100 | #207 | Poor 12.4% |
| Potawatomi | 14.6 /100 | #208 | Poor 12.5% |
| Immigrants | Sierra Leone | 12.9 /100 | #209 | Poor 12.5% |
| Immigrants | Uruguay | 12.8 /100 | #210 | Poor 12.5% |
| Colombians | 10.2 /100 | #211 | Poor 12.6% |
| Malaysians | 8.5 /100 | #212 | Tragic 12.7% |
| Moroccans | 7.6 /100 | #213 | Tragic 12.8% |
| Immigrants | Africa | 7.6 /100 | #214 | Tragic 12.8% |
| Native Hawaiians | 6.7 /100 | #215 | Tragic 12.8% |
| Immigrants | South America | 6.5 /100 | #216 | Tragic 12.8% |
| Immigrants | Burma/Myanmar | 6.0 /100 | #217 | Tragic 12.9% |
| Hawaiians | 5.4 /100 | #218 | Tragic 12.9% |