Immigrants from Zaire vs Colombian Single Male Poverty
COMPARE
Immigrants from Zaire
Colombian
Single Male Poverty
Single Male Poverty Comparison
Immigrants from Zaire
Colombians
13.6%
SINGLE MALE POVERTY
0.9/ 100
METRIC RATING
251st/ 347
METRIC RANK
12.2%
SINGLE MALE POVERTY
97.8/ 100
METRIC RATING
94th/ 347
METRIC RANK
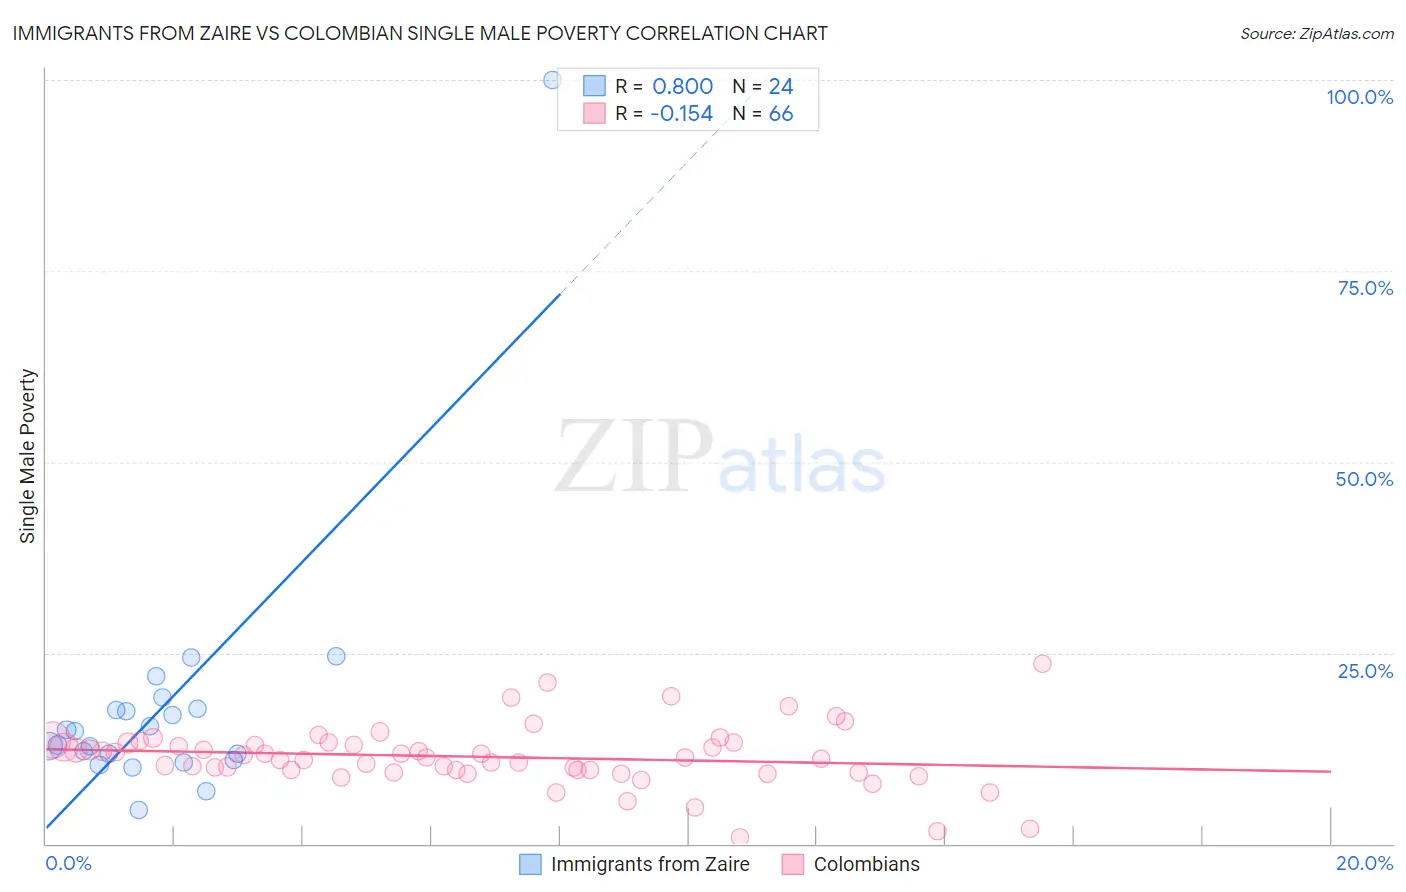
Immigrants from Zaire vs Colombian Single Male Poverty Correlation Chart
The statistical analysis conducted on geographies consisting of 103,503,403 people shows a strong positive correlation between the proportion of Immigrants from Zaire and poverty level among single males in the United States with a correlation coefficient (R) of 0.800 and weighted average of 13.6%. Similarly, the statistical analysis conducted on geographies consisting of 370,615,335 people shows a poor negative correlation between the proportion of Colombians and poverty level among single males in the United States with a correlation coefficient (R) of -0.154 and weighted average of 12.2%, a difference of 11.8%.
Single Male Poverty Correlation Summary
| Measurement | Immigrants from Zaire | Colombian |
| Minimum | 4.4% | 0.77% |
| Maximum | 100.0% | 23.6% |
| Range | 95.6% | 22.8% |
| Mean | 18.0% | 11.4% |
| Median | 13.8% | 11.3% |
| Interquartile 25% (IQ1) | 11.3% | 9.6% |
| Interquartile 75% (IQ3) | 17.6% | 13.2% |
| Interquartile Range (IQR) | 6.2% | 3.6% |
| Standard Deviation (Sample) | 18.2% | 4.0% |
| Standard Deviation (Population) | 17.8% | 4.0% |
Similar Demographics by Single Male Poverty
Demographics Similar to Immigrants from Zaire by Single Male Poverty
In terms of single male poverty, the demographic groups most similar to Immigrants from Zaire are Finnish (13.6%, a difference of 0.050%), Immigrants from Somalia (13.6%, a difference of 0.11%), Spanish (13.6%, a difference of 0.13%), German Russian (13.6%, a difference of 0.19%), and Czech (13.5%, a difference of 0.37%).
| Demographics | Rating | Rank | Single Male Poverty |
| Immigrants | Senegal | 1.7 /100 | #244 | Tragic 13.5% |
| Immigrants | Latin America | 1.3 /100 | #245 | Tragic 13.5% |
| Immigrants | Micronesia | 1.2 /100 | #246 | Tragic 13.5% |
| Belgians | 1.2 /100 | #247 | Tragic 13.5% |
| Czechs | 1.2 /100 | #248 | Tragic 13.5% |
| Spanish | 1.0 /100 | #249 | Tragic 13.6% |
| Immigrants | Somalia | 1.0 /100 | #250 | Tragic 13.6% |
| Immigrants | Zaire | 0.9 /100 | #251 | Tragic 13.6% |
| Finns | 0.9 /100 | #252 | Tragic 13.6% |
| German Russians | 0.8 /100 | #253 | Tragic 13.6% |
| Sub-Saharan Africans | 0.5 /100 | #254 | Tragic 13.7% |
| Spaniards | 0.4 /100 | #255 | Tragic 13.7% |
| Immigrants | Belize | 0.4 /100 | #256 | Tragic 13.7% |
| Immigrants | Central America | 0.3 /100 | #257 | Tragic 13.8% |
| Immigrants | Guatemala | 0.3 /100 | #258 | Tragic 13.8% |
Demographics Similar to Colombians by Single Male Poverty
In terms of single male poverty, the demographic groups most similar to Colombians are Mongolian (12.2%, a difference of 0.010%), Immigrants from Bosnia and Herzegovina (12.1%, a difference of 0.12%), Immigrants from Sweden (12.2%, a difference of 0.16%), Spanish American Indian (12.1%, a difference of 0.18%), and Immigrants from Italy (12.2%, a difference of 0.21%).
| Demographics | Rating | Rank | Single Male Poverty |
| South Americans | 98.5 /100 | #87 | Exceptional 12.1% |
| Immigrants | Eritrea | 98.5 /100 | #88 | Exceptional 12.1% |
| Immigrants | Ireland | 98.3 /100 | #89 | Exceptional 12.1% |
| South American Indians | 98.3 /100 | #90 | Exceptional 12.1% |
| Immigrants | Turkey | 98.2 /100 | #91 | Exceptional 12.1% |
| Spanish American Indians | 98.0 /100 | #92 | Exceptional 12.1% |
| Immigrants | Bosnia and Herzegovina | 97.9 /100 | #93 | Exceptional 12.1% |
| Colombians | 97.8 /100 | #94 | Exceptional 12.2% |
| Mongolians | 97.7 /100 | #95 | Exceptional 12.2% |
| Immigrants | Sweden | 97.5 /100 | #96 | Exceptional 12.2% |
| Immigrants | Italy | 97.4 /100 | #97 | Exceptional 12.2% |
| Guamanians/Chamorros | 97.4 /100 | #98 | Exceptional 12.2% |
| Immigrants | Cuba | 97.3 /100 | #99 | Exceptional 12.2% |
| Immigrants | Australia | 97.1 /100 | #100 | Exceptional 12.2% |
| Immigrants | Latvia | 97.0 /100 | #101 | Exceptional 12.2% |