Immigrants from Spain vs Colombian Single Male Poverty
COMPARE
Immigrants from Spain
Colombian
Single Male Poverty
Single Male Poverty Comparison
Immigrants from Spain
Colombians
12.7%
SINGLE MALE POVERTY
68.7/ 100
METRIC RATING
155th/ 347
METRIC RANK
12.2%
SINGLE MALE POVERTY
97.8/ 100
METRIC RATING
94th/ 347
METRIC RANK
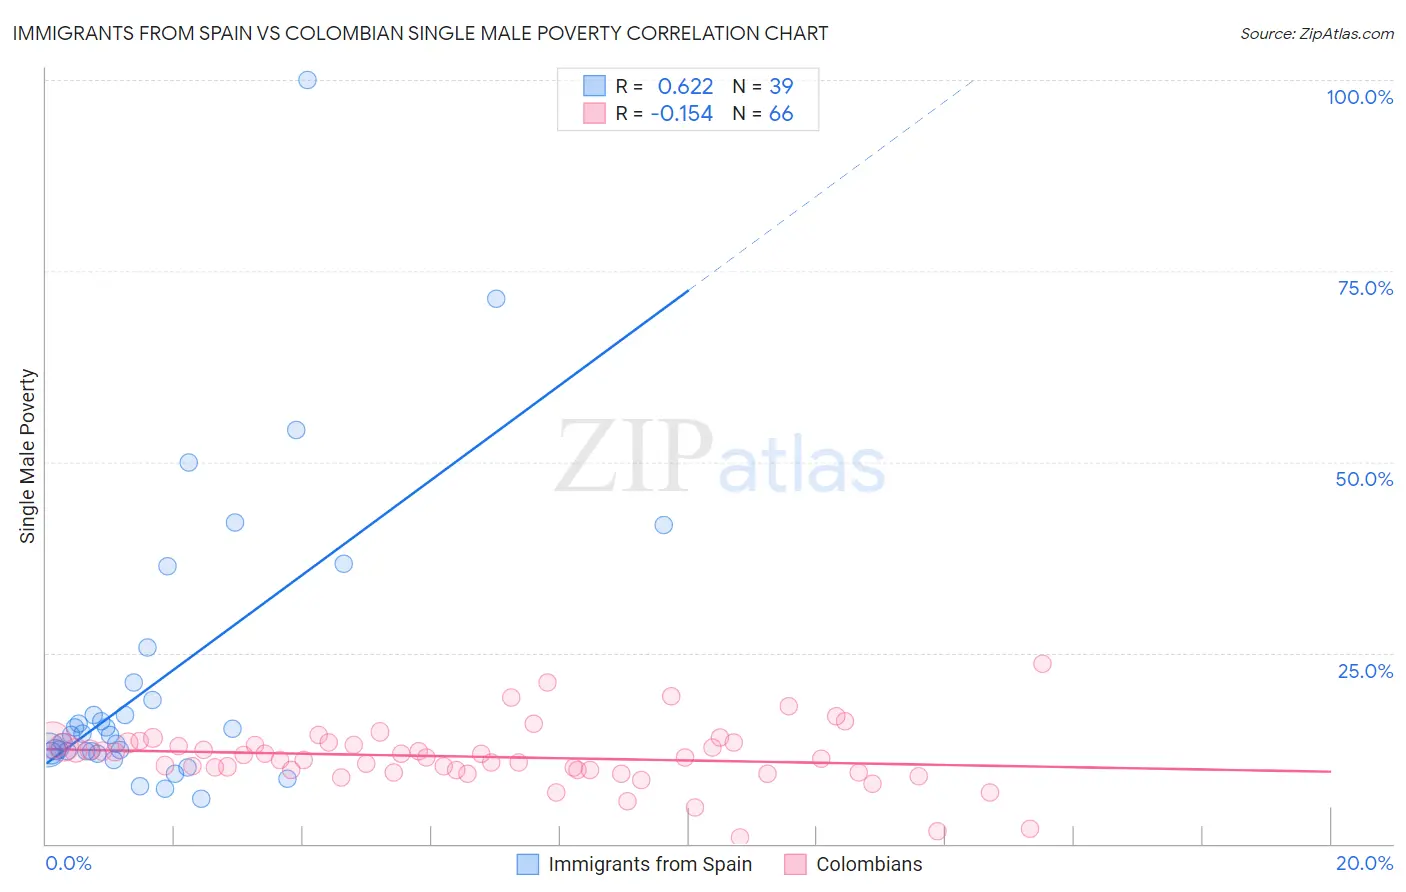
Immigrants from Spain vs Colombian Single Male Poverty Correlation Chart
The statistical analysis conducted on geographies consisting of 219,998,655 people shows a significant positive correlation between the proportion of Immigrants from Spain and poverty level among single males in the United States with a correlation coefficient (R) of 0.622 and weighted average of 12.7%. Similarly, the statistical analysis conducted on geographies consisting of 370,615,335 people shows a poor negative correlation between the proportion of Colombians and poverty level among single males in the United States with a correlation coefficient (R) of -0.154 and weighted average of 12.2%, a difference of 4.2%.
Single Male Poverty Correlation Summary
| Measurement | Immigrants from Spain | Colombian |
| Minimum | 5.9% | 0.77% |
| Maximum | 100.0% | 23.6% |
| Range | 94.1% | 22.8% |
| Mean | 21.7% | 11.4% |
| Median | 14.2% | 11.3% |
| Interquartile 25% (IQ1) | 12.1% | 9.6% |
| Interquartile 75% (IQ3) | 21.0% | 13.2% |
| Interquartile Range (IQR) | 9.0% | 3.6% |
| Standard Deviation (Sample) | 19.4% | 4.0% |
| Standard Deviation (Population) | 19.2% | 4.0% |
Similar Demographics by Single Male Poverty
Demographics Similar to Immigrants from Spain by Single Male Poverty
In terms of single male poverty, the demographic groups most similar to Immigrants from Spain are Immigrants from Scotland (12.7%, a difference of 0.020%), Vietnamese (12.7%, a difference of 0.040%), Latvian (12.7%, a difference of 0.040%), Immigrants (12.7%, a difference of 0.090%), and Australian (12.6%, a difference of 0.17%).
| Demographics | Rating | Rank | Single Male Poverty |
| Yugoslavians | 73.9 /100 | #148 | Good 12.6% |
| Sierra Leoneans | 73.0 /100 | #149 | Good 12.6% |
| Immigrants | Panama | 72.1 /100 | #150 | Good 12.6% |
| Immigrants | Hungary | 71.9 /100 | #151 | Good 12.6% |
| Australians | 71.4 /100 | #152 | Good 12.6% |
| Immigrants | Immigrants | 70.1 /100 | #153 | Good 12.7% |
| Immigrants | Scotland | 68.9 /100 | #154 | Good 12.7% |
| Immigrants | Spain | 68.7 /100 | #155 | Good 12.7% |
| Vietnamese | 67.9 /100 | #156 | Good 12.7% |
| Latvians | 67.9 /100 | #157 | Good 12.7% |
| Immigrants | Middle Africa | 64.9 /100 | #158 | Good 12.7% |
| Immigrants | Liberia | 64.2 /100 | #159 | Good 12.7% |
| Greeks | 64.1 /100 | #160 | Good 12.7% |
| Immigrants | Africa | 63.4 /100 | #161 | Good 12.7% |
| Eastern Europeans | 63.3 /100 | #162 | Good 12.7% |
Demographics Similar to Colombians by Single Male Poverty
In terms of single male poverty, the demographic groups most similar to Colombians are Mongolian (12.2%, a difference of 0.010%), Immigrants from Bosnia and Herzegovina (12.1%, a difference of 0.12%), Immigrants from Sweden (12.2%, a difference of 0.16%), Spanish American Indian (12.1%, a difference of 0.18%), and Immigrants from Italy (12.2%, a difference of 0.21%).
| Demographics | Rating | Rank | Single Male Poverty |
| South Americans | 98.5 /100 | #87 | Exceptional 12.1% |
| Immigrants | Eritrea | 98.5 /100 | #88 | Exceptional 12.1% |
| Immigrants | Ireland | 98.3 /100 | #89 | Exceptional 12.1% |
| South American Indians | 98.3 /100 | #90 | Exceptional 12.1% |
| Immigrants | Turkey | 98.2 /100 | #91 | Exceptional 12.1% |
| Spanish American Indians | 98.0 /100 | #92 | Exceptional 12.1% |
| Immigrants | Bosnia and Herzegovina | 97.9 /100 | #93 | Exceptional 12.1% |
| Colombians | 97.8 /100 | #94 | Exceptional 12.2% |
| Mongolians | 97.7 /100 | #95 | Exceptional 12.2% |
| Immigrants | Sweden | 97.5 /100 | #96 | Exceptional 12.2% |
| Immigrants | Italy | 97.4 /100 | #97 | Exceptional 12.2% |
| Guamanians/Chamorros | 97.4 /100 | #98 | Exceptional 12.2% |
| Immigrants | Cuba | 97.3 /100 | #99 | Exceptional 12.2% |
| Immigrants | Australia | 97.1 /100 | #100 | Exceptional 12.2% |
| Immigrants | Latvia | 97.0 /100 | #101 | Exceptional 12.2% |