Yakama vs Colombian Householder Income Under 25 years
COMPARE
Yakama
Colombian
Householder Income Under 25 years
Householder Income Under 25 years Comparison
Yakama
Colombians
$54,321
HOUSEHOLDER INCOME UNDER 25 YEARS
99.5/ 100
METRIC RATING
88th/ 347
METRIC RANK
$53,357
HOUSEHOLDER INCOME UNDER 25 YEARS
94.6/ 100
METRIC RATING
124th/ 347
METRIC RANK
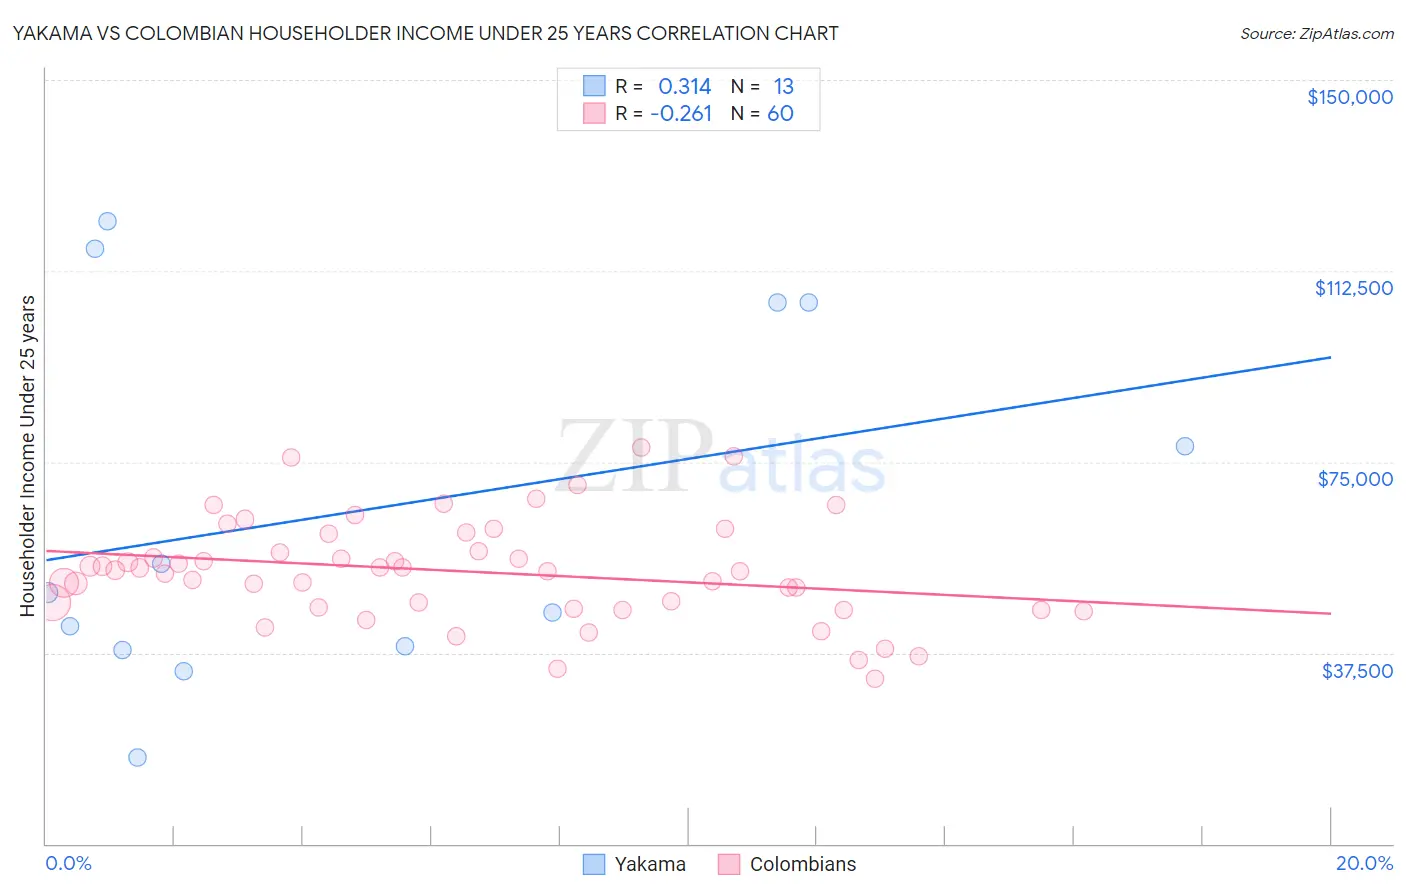
Yakama vs Colombian Householder Income Under 25 years Correlation Chart
The statistical analysis conducted on geographies consisting of 18,988,829 people shows a mild positive correlation between the proportion of Yakama and household income with householder under the age of 25 in the United States with a correlation coefficient (R) of 0.314 and weighted average of $54,321. Similarly, the statistical analysis conducted on geographies consisting of 350,831,291 people shows a weak negative correlation between the proportion of Colombians and household income with householder under the age of 25 in the United States with a correlation coefficient (R) of -0.261 and weighted average of $53,357, a difference of 1.8%.
Householder Income Under 25 years Correlation Summary
| Measurement | Yakama | Colombian |
| Minimum | $17,019 | $32,315 |
| Maximum | $122,325 | $77,798 |
| Range | $105,306 | $45,483 |
| Mean | $65,370 | $53,495 |
| Median | $49,297 | $53,679 |
| Interquartile 25% (IQ1) | $38,384 | $46,265 |
| Interquartile 75% (IQ3) | $106,250 | $59,118 |
| Interquartile Range (IQR) | $67,866 | $12,853 |
| Standard Deviation (Sample) | $35,875 | $10,089 |
| Standard Deviation (Population) | $34,468 | $10,004 |
Similar Demographics by Householder Income Under 25 years
Demographics Similar to Yakama by Householder Income Under 25 years
In terms of householder income under 25 years, the demographic groups most similar to Yakama are Brazilian ($54,335, a difference of 0.030%), Immigrants from Croatia ($54,343, a difference of 0.040%), Bulgarian ($54,352, a difference of 0.060%), Immigrants from Czechoslovakia ($54,352, a difference of 0.060%), and Laotian ($54,369, a difference of 0.090%).
| Demographics | Rating | Rank | Householder Income Under 25 years |
| Portuguese | 99.6 /100 | #81 | Exceptional $54,436 |
| Russians | 99.5 /100 | #82 | Exceptional $54,389 |
| Laotians | 99.5 /100 | #83 | Exceptional $54,369 |
| Bulgarians | 99.5 /100 | #84 | Exceptional $54,352 |
| Immigrants | Czechoslovakia | 99.5 /100 | #85 | Exceptional $54,352 |
| Immigrants | Croatia | 99.5 /100 | #86 | Exceptional $54,343 |
| Brazilians | 99.5 /100 | #87 | Exceptional $54,335 |
| Yakama | 99.5 /100 | #88 | Exceptional $54,321 |
| Immigrants | South America | 99.4 /100 | #89 | Exceptional $54,268 |
| Turks | 99.4 /100 | #90 | Exceptional $54,266 |
| Immigrants | Egypt | 99.3 /100 | #91 | Exceptional $54,239 |
| Immigrants | St. Vincent and the Grenadines | 99.3 /100 | #92 | Exceptional $54,230 |
| Immigrants | Argentina | 99.3 /100 | #93 | Exceptional $54,209 |
| Immigrants | Sierra Leone | 99.3 /100 | #94 | Exceptional $54,190 |
| Immigrants | Malaysia | 99.2 /100 | #95 | Exceptional $54,179 |
Demographics Similar to Colombians by Householder Income Under 25 years
In terms of householder income under 25 years, the demographic groups most similar to Colombians are Immigrants from Iraq ($53,384, a difference of 0.050%), Pakistani ($53,325, a difference of 0.060%), Immigrants from Serbia ($53,321, a difference of 0.070%), Immigrants from North America ($53,307, a difference of 0.090%), and Immigrants from Canada ($53,411, a difference of 0.10%).
| Demographics | Rating | Rank | Householder Income Under 25 years |
| Lithuanians | 96.6 /100 | #117 | Exceptional $53,552 |
| Immigrants | Switzerland | 96.3 /100 | #118 | Exceptional $53,528 |
| Italians | 95.4 /100 | #119 | Exceptional $53,426 |
| Guamanians/Chamorros | 95.3 /100 | #120 | Exceptional $53,423 |
| Immigrants | Canada | 95.2 /100 | #121 | Exceptional $53,411 |
| Immigrants | Ethiopia | 95.2 /100 | #122 | Exceptional $53,408 |
| Immigrants | Iraq | 94.9 /100 | #123 | Exceptional $53,384 |
| Colombians | 94.6 /100 | #124 | Exceptional $53,357 |
| Pakistanis | 94.1 /100 | #125 | Exceptional $53,325 |
| Immigrants | Serbia | 94.1 /100 | #126 | Exceptional $53,321 |
| Immigrants | North America | 93.9 /100 | #127 | Exceptional $53,307 |
| Immigrants | Bulgaria | 93.9 /100 | #128 | Exceptional $53,305 |
| New Zealanders | 93.7 /100 | #129 | Exceptional $53,294 |
| Nicaraguans | 93.4 /100 | #130 | Exceptional $53,275 |
| Immigrants | Nicaragua | 93.3 /100 | #131 | Exceptional $53,266 |