Immigrants from Senegal vs Czechoslovakian Single Female Poverty
COMPARE
Immigrants from Senegal
Czechoslovakian
Single Female Poverty
Single Female Poverty Comparison
Immigrants from Senegal
Czechoslovakians
23.2%
SINGLE FEMALE POVERTY
0.1/ 100
METRIC RATING
272nd/ 347
METRIC RANK
21.3%
SINGLE FEMALE POVERTY
27.7/ 100
METRIC RATING
194th/ 347
METRIC RANK
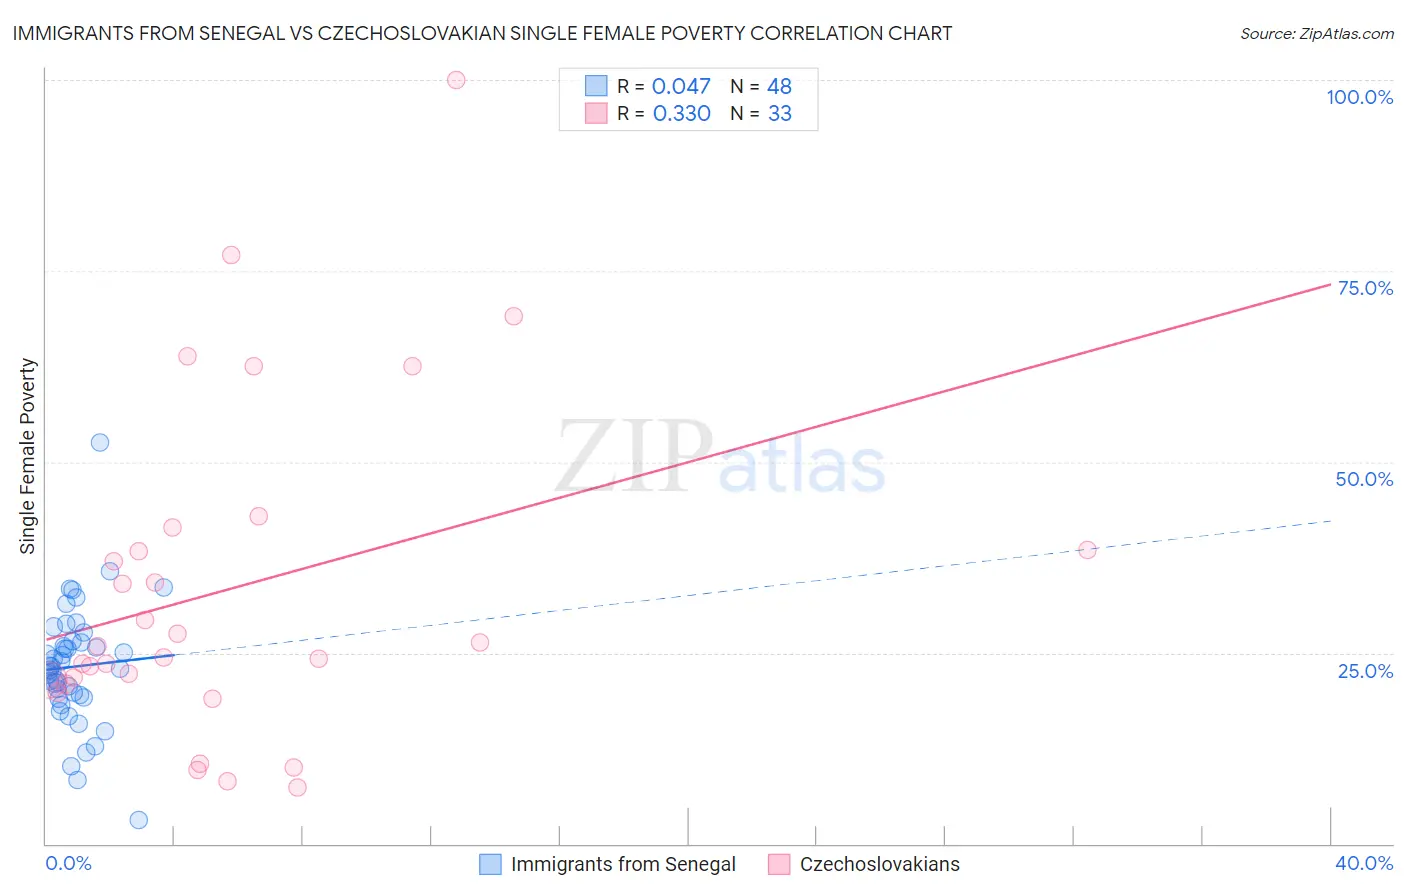
Immigrants from Senegal vs Czechoslovakian Single Female Poverty Correlation Chart
The statistical analysis conducted on geographies consisting of 89,958,915 people shows no correlation between the proportion of Immigrants from Senegal and poverty level among single females in the United States with a correlation coefficient (R) of 0.047 and weighted average of 23.2%. Similarly, the statistical analysis conducted on geographies consisting of 361,916,280 people shows a mild positive correlation between the proportion of Czechoslovakians and poverty level among single females in the United States with a correlation coefficient (R) of 0.330 and weighted average of 21.3%, a difference of 9.0%.
Single Female Poverty Correlation Summary
| Measurement | Immigrants from Senegal | Czechoslovakian |
| Minimum | 3.0% | 7.4% |
| Maximum | 52.6% | 100.0% |
| Range | 49.6% | 92.6% |
| Mean | 23.2% | 33.3% |
| Median | 23.1% | 25.9% |
| Interquartile 25% (IQ1) | 19.3% | 21.1% |
| Interquartile 75% (IQ3) | 26.4% | 39.9% |
| Interquartile Range (IQR) | 7.1% | 18.8% |
| Standard Deviation (Sample) | 8.0% | 21.6% |
| Standard Deviation (Population) | 7.9% | 21.3% |
Similar Demographics by Single Female Poverty
Demographics Similar to Immigrants from Senegal by Single Female Poverty
In terms of single female poverty, the demographic groups most similar to Immigrants from Senegal are Subsaharan African (23.2%, a difference of 0.19%), Alaska Native (23.3%, a difference of 0.25%), Marshallese (23.3%, a difference of 0.26%), Inupiat (23.1%, a difference of 0.43%), and Mexican American Indian (23.4%, a difference of 0.53%).
| Demographics | Rating | Rank | Single Female Poverty |
| Central Americans | 0.2 /100 | #265 | Tragic 23.0% |
| Immigrants | Micronesia | 0.2 /100 | #266 | Tragic 23.0% |
| Senegalese | 0.2 /100 | #267 | Tragic 23.0% |
| Fijians | 0.2 /100 | #268 | Tragic 23.1% |
| Hmong | 0.2 /100 | #269 | Tragic 23.1% |
| Inupiat | 0.2 /100 | #270 | Tragic 23.1% |
| Sub-Saharan Africans | 0.1 /100 | #271 | Tragic 23.2% |
| Immigrants | Senegal | 0.1 /100 | #272 | Tragic 23.2% |
| Alaska Natives | 0.1 /100 | #273 | Tragic 23.3% |
| Marshallese | 0.1 /100 | #274 | Tragic 23.3% |
| Mexican American Indians | 0.1 /100 | #275 | Tragic 23.4% |
| Immigrants | Azores | 0.0 /100 | #276 | Tragic 23.5% |
| Pennsylvania Germans | 0.0 /100 | #277 | Tragic 23.6% |
| Immigrants | Nonimmigrants | 0.0 /100 | #278 | Tragic 23.6% |
| Alaskan Athabascans | 0.0 /100 | #279 | Tragic 23.6% |
Demographics Similar to Czechoslovakians by Single Female Poverty
In terms of single female poverty, the demographic groups most similar to Czechoslovakians are Nicaraguan (21.3%, a difference of 0.010%), Basque (21.3%, a difference of 0.030%), Immigrants from Saudi Arabia (21.3%, a difference of 0.050%), Japanese (21.3%, a difference of 0.10%), and Immigrants from Jamaica (21.3%, a difference of 0.21%).
| Demographics | Rating | Rank | Single Female Poverty |
| Immigrants | Nigeria | 36.8 /100 | #187 | Fair 21.2% |
| Yugoslavians | 35.4 /100 | #188 | Fair 21.2% |
| Immigrants | Cuba | 35.3 /100 | #189 | Fair 21.2% |
| Trinidadians and Tobagonians | 35.2 /100 | #190 | Fair 21.2% |
| Immigrants | Germany | 31.1 /100 | #191 | Fair 21.3% |
| Immigrants | Jamaica | 30.5 /100 | #192 | Fair 21.3% |
| Basques | 28.1 /100 | #193 | Fair 21.3% |
| Czechoslovakians | 27.7 /100 | #194 | Fair 21.3% |
| Nicaraguans | 27.6 /100 | #195 | Fair 21.3% |
| Immigrants | Saudi Arabia | 27.1 /100 | #196 | Fair 21.3% |
| Japanese | 26.4 /100 | #197 | Fair 21.3% |
| Swiss | 24.2 /100 | #198 | Fair 21.4% |
| Immigrants | Immigrants | 22.0 /100 | #199 | Fair 21.4% |
| Irish | 21.4 /100 | #200 | Fair 21.4% |
| Nigerians | 20.9 /100 | #201 | Fair 21.4% |