Czech vs Czechoslovakian Single Female Poverty
COMPARE
Czech
Czechoslovakian
Single Female Poverty
Single Female Poverty Comparison
Czechs
Czechoslovakians
21.0%
SINGLE FEMALE POVERTY
46.8/ 100
METRIC RATING
175th/ 347
METRIC RANK
21.3%
SINGLE FEMALE POVERTY
27.7/ 100
METRIC RATING
194th/ 347
METRIC RANK
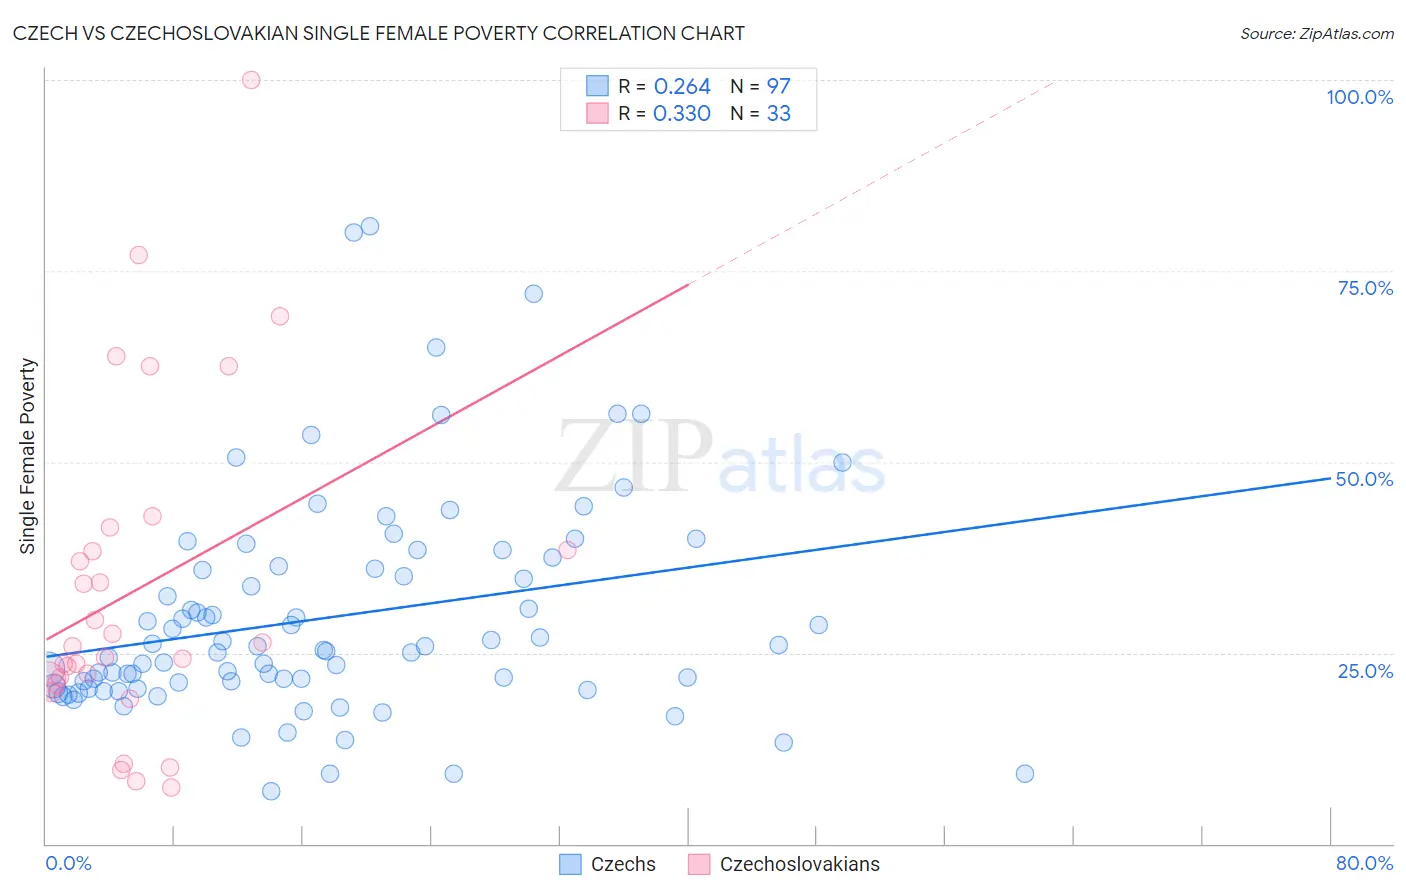
Czech vs Czechoslovakian Single Female Poverty Correlation Chart
The statistical analysis conducted on geographies consisting of 472,282,128 people shows a weak positive correlation between the proportion of Czechs and poverty level among single females in the United States with a correlation coefficient (R) of 0.264 and weighted average of 21.0%. Similarly, the statistical analysis conducted on geographies consisting of 361,916,280 people shows a mild positive correlation between the proportion of Czechoslovakians and poverty level among single females in the United States with a correlation coefficient (R) of 0.330 and weighted average of 21.3%, a difference of 1.3%.
Single Female Poverty Correlation Summary
| Measurement | Czech | Czechoslovakian |
| Minimum | 6.8% | 7.4% |
| Maximum | 80.9% | 100.0% |
| Range | 74.1% | 92.6% |
| Mean | 29.6% | 33.3% |
| Median | 25.3% | 25.9% |
| Interquartile 25% (IQ1) | 20.5% | 21.1% |
| Interquartile 75% (IQ3) | 36.2% | 39.9% |
| Interquartile Range (IQR) | 15.7% | 18.8% |
| Standard Deviation (Sample) | 14.3% | 21.6% |
| Standard Deviation (Population) | 14.3% | 21.3% |
Demographics Similar to Czechs and Czechoslovakians by Single Female Poverty
In terms of single female poverty, the demographic groups most similar to Czechs are Canadian (21.1%, a difference of 0.080%), Scandinavian (21.1%, a difference of 0.10%), Immigrants from Bosnia and Herzegovina (21.1%, a difference of 0.12%), Cuban (21.0%, a difference of 0.20%), and British (21.1%, a difference of 0.24%). Similarly, the demographic groups most similar to Czechoslovakians are Basque (21.3%, a difference of 0.030%), Immigrants from Jamaica (21.3%, a difference of 0.21%), Immigrants from Germany (21.3%, a difference of 0.25%), Immigrants from Cuba (21.2%, a difference of 0.54%), and Trinidadian and Tobagonian (21.2%, a difference of 0.54%).
| Demographics | Rating | Rank | Single Female Poverty |
| Cubans | 50.0 /100 | #174 | Average 21.0% |
| Czechs | 46.8 /100 | #175 | Average 21.0% |
| Canadians | 45.4 /100 | #176 | Average 21.1% |
| Scandinavians | 45.2 /100 | #177 | Average 21.1% |
| Immigrants | Bosnia and Herzegovina | 44.9 /100 | #178 | Average 21.1% |
| British | 42.9 /100 | #179 | Average 21.1% |
| Spanish American Indians | 42.5 /100 | #180 | Average 21.1% |
| Europeans | 42.3 /100 | #181 | Average 21.1% |
| Slavs | 40.5 /100 | #182 | Average 21.1% |
| Slovaks | 39.7 /100 | #183 | Fair 21.1% |
| Hungarians | 39.6 /100 | #184 | Fair 21.1% |
| Immigrants | Cambodia | 38.2 /100 | #185 | Fair 21.2% |
| Hawaiians | 37.7 /100 | #186 | Fair 21.2% |
| Immigrants | Nigeria | 36.8 /100 | #187 | Fair 21.2% |
| Yugoslavians | 35.4 /100 | #188 | Fair 21.2% |
| Immigrants | Cuba | 35.3 /100 | #189 | Fair 21.2% |
| Trinidadians and Tobagonians | 35.2 /100 | #190 | Fair 21.2% |
| Immigrants | Germany | 31.1 /100 | #191 | Fair 21.3% |
| Immigrants | Jamaica | 30.5 /100 | #192 | Fair 21.3% |
| Basques | 28.1 /100 | #193 | Fair 21.3% |
| Czechoslovakians | 27.7 /100 | #194 | Fair 21.3% |