Korean vs Jordanian Single Father Poverty
COMPARE
Korean
Jordanian
Single Father Poverty
Single Father Poverty Comparison
Koreans
Jordanians
14.0%
SINGLE FATHER POVERTY
100.0/ 100
METRIC RATING
10th/ 347
METRIC RANK
16.1%
SINGLE FATHER POVERTY
74.2/ 100
METRIC RATING
150th/ 347
METRIC RANK
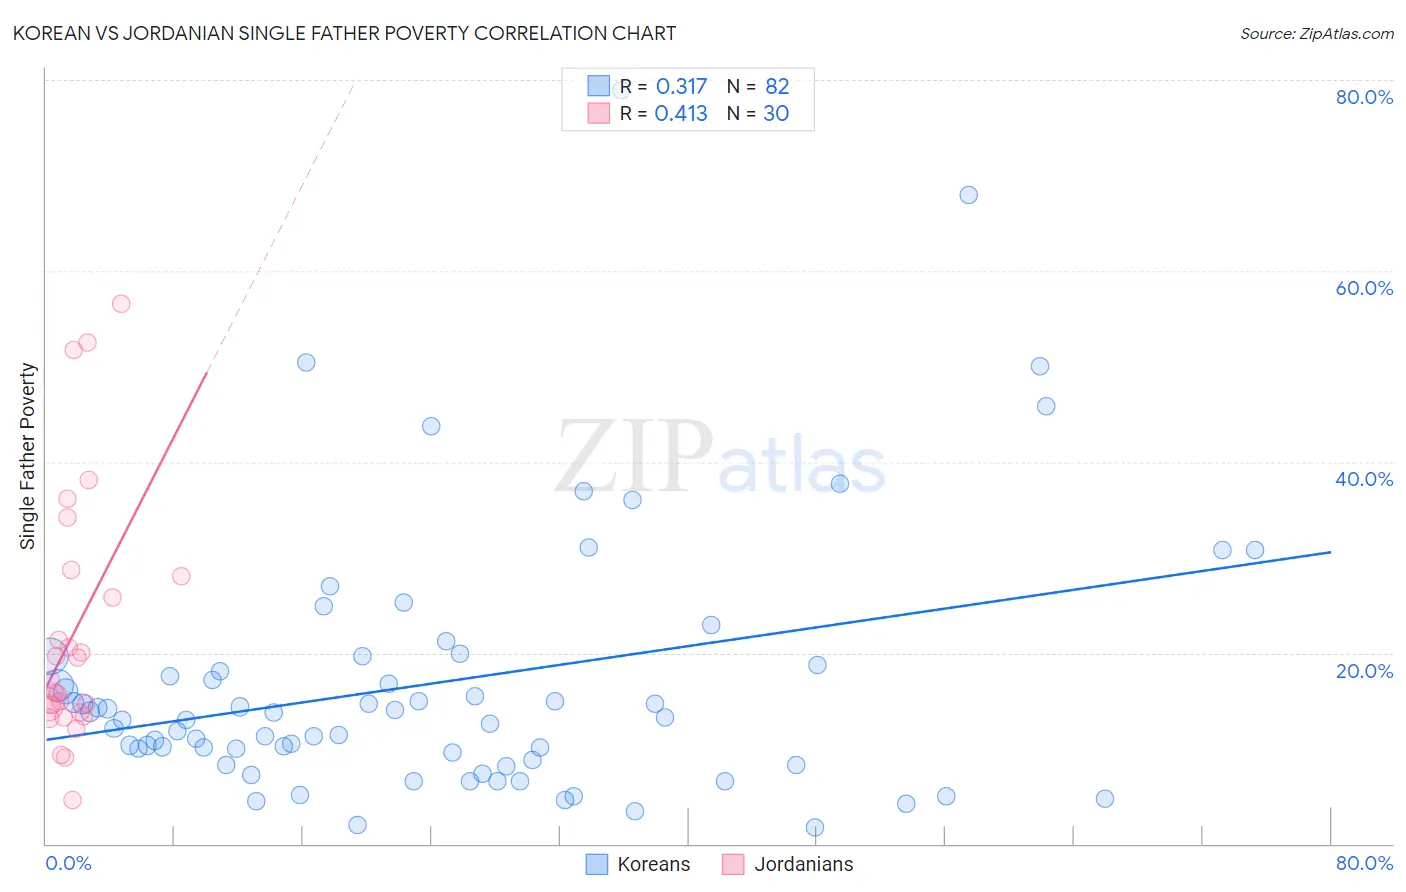
Korean vs Jordanian Single Father Poverty Correlation Chart
The statistical analysis conducted on geographies consisting of 383,489,954 people shows a mild positive correlation between the proportion of Koreans and poverty level among single fathers in the United States with a correlation coefficient (R) of 0.317 and weighted average of 14.0%. Similarly, the statistical analysis conducted on geographies consisting of 144,384,155 people shows a moderate positive correlation between the proportion of Jordanians and poverty level among single fathers in the United States with a correlation coefficient (R) of 0.413 and weighted average of 16.1%, a difference of 15.3%.
Single Father Poverty Correlation Summary
| Measurement | Korean | Jordanian |
| Minimum | 1.8% | 4.6% |
| Maximum | 78.9% | 56.5% |
| Range | 77.1% | 51.9% |
| Mean | 16.9% | 22.1% |
| Median | 13.1% | 16.5% |
| Interquartile 25% (IQ1) | 8.8% | 13.8% |
| Interquartile 75% (IQ3) | 18.8% | 28.0% |
| Interquartile Range (IQR) | 9.9% | 14.2% |
| Standard Deviation (Sample) | 14.0% | 13.3% |
| Standard Deviation (Population) | 13.9% | 13.1% |
Similar Demographics by Single Father Poverty
Demographics Similar to Koreans by Single Father Poverty
In terms of single father poverty, the demographic groups most similar to Koreans are Afghan (14.0%, a difference of 0.10%), Filipino (14.0%, a difference of 0.40%), Immigrants from India (14.0%, a difference of 0.41%), Immigrants from Philippines (14.0%, a difference of 0.55%), and Samoan (13.8%, a difference of 1.2%).
| Demographics | Rating | Rank | Single Father Poverty |
| Tsimshian | 100.0 /100 | #3 | Exceptional 12.7% |
| Immigrants | Fiji | 100.0 /100 | #4 | Exceptional 13.2% |
| Immigrants | Ethiopia | 100.0 /100 | #5 | Exceptional 13.4% |
| Ethiopians | 100.0 /100 | #6 | Exceptional 13.5% |
| Immigrants | Taiwan | 100.0 /100 | #7 | Exceptional 13.7% |
| Samoans | 100.0 /100 | #8 | Exceptional 13.8% |
| Afghans | 100.0 /100 | #9 | Exceptional 14.0% |
| Koreans | 100.0 /100 | #10 | Exceptional 14.0% |
| Filipinos | 100.0 /100 | #11 | Exceptional 14.0% |
| Immigrants | India | 100.0 /100 | #12 | Exceptional 14.0% |
| Immigrants | Philippines | 100.0 /100 | #13 | Exceptional 14.0% |
| Immigrants | Vietnam | 100.0 /100 | #14 | Exceptional 14.1% |
| Sri Lankans | 100.0 /100 | #15 | Exceptional 14.2% |
| Immigrants | Iran | 100.0 /100 | #16 | Exceptional 14.2% |
| Immigrants | Hong Kong | 100.0 /100 | #17 | Exceptional 14.2% |
Demographics Similar to Jordanians by Single Father Poverty
In terms of single father poverty, the demographic groups most similar to Jordanians are South African (16.1%, a difference of 0.060%), Immigrants from France (16.1%, a difference of 0.060%), Immigrants from Zimbabwe (16.1%, a difference of 0.12%), Immigrants from Israel (16.1%, a difference of 0.13%), and Nigerian (16.1%, a difference of 0.16%).
| Demographics | Rating | Rank | Single Father Poverty |
| Immigrants | Central America | 83.1 /100 | #143 | Excellent 16.0% |
| Immigrants | Kuwait | 81.4 /100 | #144 | Excellent 16.0% |
| Immigrants | Western Asia | 80.7 /100 | #145 | Excellent 16.0% |
| Immigrants | Hungary | 78.3 /100 | #146 | Good 16.1% |
| Colombians | 77.1 /100 | #147 | Good 16.1% |
| Nigerians | 76.8 /100 | #148 | Good 16.1% |
| South Africans | 75.1 /100 | #149 | Good 16.1% |
| Jordanians | 74.2 /100 | #150 | Good 16.1% |
| Immigrants | France | 73.1 /100 | #151 | Good 16.1% |
| Immigrants | Zimbabwe | 72.1 /100 | #152 | Good 16.1% |
| Immigrants | Israel | 72.0 /100 | #153 | Good 16.1% |
| Mexicans | 70.1 /100 | #154 | Good 16.1% |
| Immigrants | Nicaragua | 67.8 /100 | #155 | Good 16.2% |
| Immigrants | Jordan | 66.0 /100 | #156 | Good 16.2% |
| Immigrants | Czechoslovakia | 62.8 /100 | #157 | Good 16.2% |