Welsh vs Jordanian Hearing Disability
COMPARE
Welsh
Jordanian
Hearing Disability
Hearing Disability Comparison
Welsh
Jordanians
3.7%
HEARING DISABILITY
0.0/ 100
METRIC RATING
295th/ 347
METRIC RANK
2.8%
HEARING DISABILITY
89.5/ 100
METRIC RATING
120th/ 347
METRIC RANK
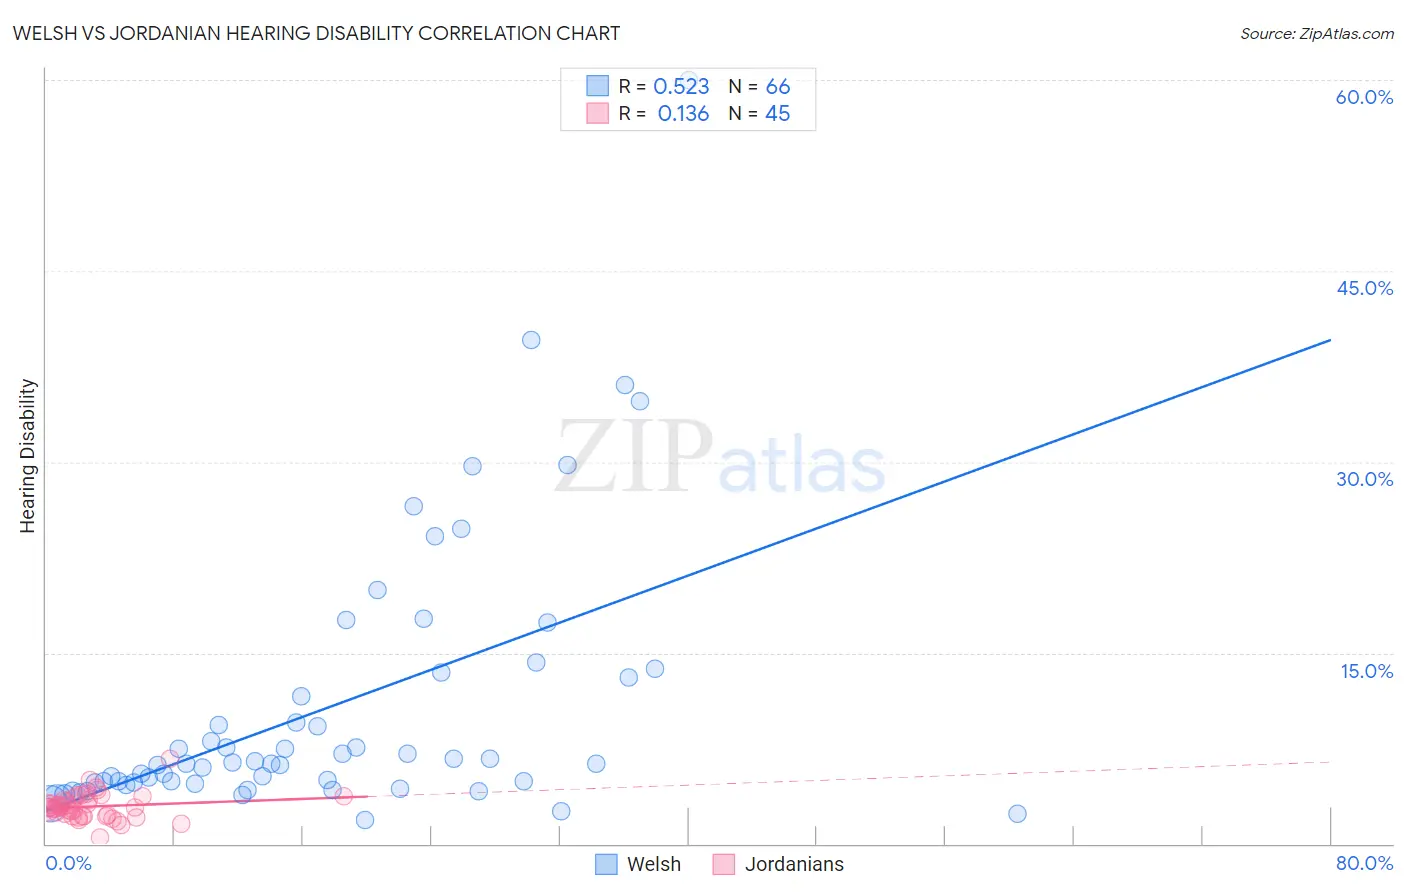
Welsh vs Jordanian Hearing Disability Correlation Chart
The statistical analysis conducted on geographies consisting of 528,244,925 people shows a substantial positive correlation between the proportion of Welsh and percentage of population with hearing disability in the United States with a correlation coefficient (R) of 0.523 and weighted average of 3.7%. Similarly, the statistical analysis conducted on geographies consisting of 166,401,829 people shows a poor positive correlation between the proportion of Jordanians and percentage of population with hearing disability in the United States with a correlation coefficient (R) of 0.136 and weighted average of 2.8%, a difference of 30.4%.
Hearing Disability Correlation Summary
| Measurement | Welsh | Jordanian |
| Minimum | 1.9% | 0.50% |
| Maximum | 60.0% | 6.7% |
| Range | 58.1% | 6.2% |
| Mean | 10.7% | 2.9% |
| Median | 6.3% | 2.8% |
| Interquartile 25% (IQ1) | 4.8% | 2.2% |
| Interquartile 75% (IQ3) | 13.0% | 3.5% |
| Interquartile Range (IQR) | 8.2% | 1.4% |
| Standard Deviation (Sample) | 10.8% | 1.0% |
| Standard Deviation (Population) | 10.7% | 1.0% |
Similar Demographics by Hearing Disability
Demographics Similar to Welsh by Hearing Disability
In terms of hearing disability, the demographic groups most similar to Welsh are Pima (3.7%, a difference of 0.13%), Immigrants from the Azores (3.7%, a difference of 0.20%), Iroquois (3.7%, a difference of 0.27%), Celtic (3.7%, a difference of 0.39%), and Norwegian (3.7%, a difference of 0.51%).
| Demographics | Rating | Rank | Hearing Disability |
| Irish | 0.0 /100 | #288 | Tragic 3.7% |
| Chinese | 0.0 /100 | #289 | Tragic 3.7% |
| Whites/Caucasians | 0.0 /100 | #290 | Tragic 3.7% |
| Finns | 0.0 /100 | #291 | Tragic 3.7% |
| Native Hawaiians | 0.0 /100 | #292 | Tragic 3.7% |
| Norwegians | 0.0 /100 | #293 | Tragic 3.7% |
| Iroquois | 0.0 /100 | #294 | Tragic 3.7% |
| Welsh | 0.0 /100 | #295 | Tragic 3.7% |
| Pima | 0.0 /100 | #296 | Tragic 3.7% |
| Immigrants | Azores | 0.0 /100 | #297 | Tragic 3.7% |
| Celtics | 0.0 /100 | #298 | Tragic 3.7% |
| Germans | 0.0 /100 | #299 | Tragic 3.7% |
| Scottish | 0.0 /100 | #300 | Tragic 3.7% |
| Pennsylvania Germans | 0.0 /100 | #301 | Tragic 3.7% |
| Dutch | 0.0 /100 | #302 | Tragic 3.7% |
Demographics Similar to Jordanians by Hearing Disability
In terms of hearing disability, the demographic groups most similar to Jordanians are Cuban (2.8%, a difference of 0.030%), Kenyan (2.8%, a difference of 0.090%), Zimbabwean (2.8%, a difference of 0.11%), Immigrants from Liberia (2.8%, a difference of 0.13%), and Liberian (2.8%, a difference of 0.13%).
| Demographics | Rating | Rank | Hearing Disability |
| Immigrants | Belarus | 91.6 /100 | #113 | Exceptional 2.8% |
| Cambodians | 91.1 /100 | #114 | Exceptional 2.8% |
| Immigrants | Latin America | 90.5 /100 | #115 | Exceptional 2.8% |
| Immigrants | Immigrants | 90.3 /100 | #116 | Exceptional 2.8% |
| Immigrants | Liberia | 90.0 /100 | #117 | Excellent 2.8% |
| Zimbabweans | 89.9 /100 | #118 | Excellent 2.8% |
| Kenyans | 89.8 /100 | #119 | Excellent 2.8% |
| Jordanians | 89.5 /100 | #120 | Excellent 2.8% |
| Cubans | 89.4 /100 | #121 | Excellent 2.8% |
| Liberians | 89.0 /100 | #122 | Excellent 2.8% |
| Immigrants | Zaire | 88.6 /100 | #123 | Excellent 2.9% |
| Bahamians | 88.6 /100 | #124 | Excellent 2.9% |
| Immigrants | Albania | 88.5 /100 | #125 | Excellent 2.9% |
| Immigrants | Sudan | 87.8 /100 | #126 | Excellent 2.9% |
| South American Indians | 86.9 /100 | #127 | Excellent 2.9% |