Aleut vs Immigrants from Zaire Single Male Poverty
COMPARE
Aleut
Immigrants from Zaire
Single Male Poverty
Single Male Poverty Comparison
Aleuts
Immigrants from Zaire
15.4%
SINGLE MALE POVERTY
0.0/ 100
METRIC RATING
303rd/ 347
METRIC RANK
13.6%
SINGLE MALE POVERTY
0.9/ 100
METRIC RATING
251st/ 347
METRIC RANK
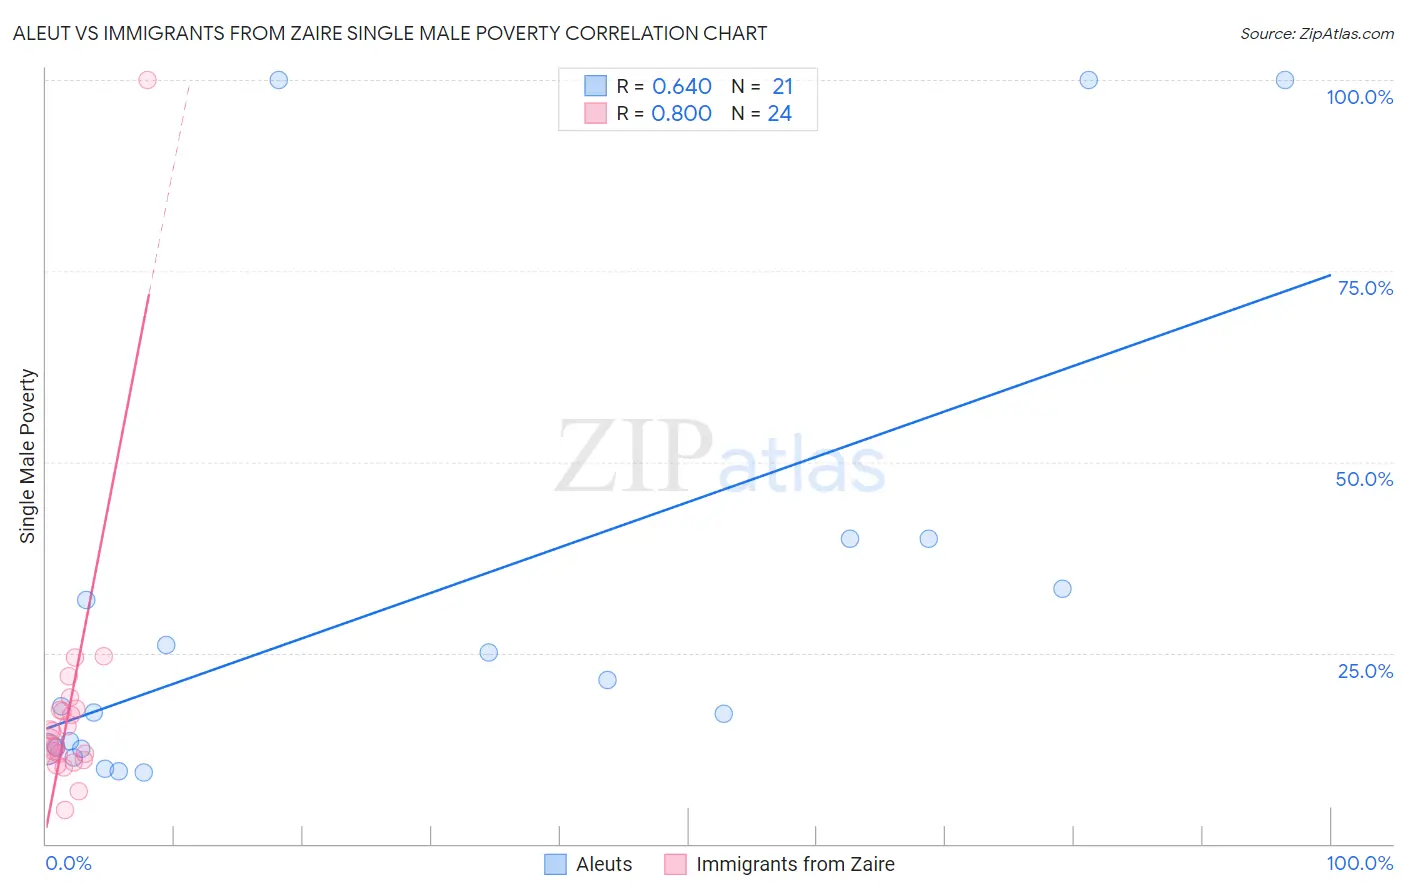
Aleut vs Immigrants from Zaire Single Male Poverty Correlation Chart
The statistical analysis conducted on geographies consisting of 59,537,447 people shows a significant positive correlation between the proportion of Aleuts and poverty level among single males in the United States with a correlation coefficient (R) of 0.640 and weighted average of 15.4%. Similarly, the statistical analysis conducted on geographies consisting of 103,503,403 people shows a strong positive correlation between the proportion of Immigrants from Zaire and poverty level among single males in the United States with a correlation coefficient (R) of 0.800 and weighted average of 13.6%, a difference of 13.3%.
Single Male Poverty Correlation Summary
| Measurement | Aleut | Immigrants from Zaire |
| Minimum | 9.3% | 4.4% |
| Maximum | 100.0% | 100.0% |
| Range | 90.7% | 95.6% |
| Mean | 31.5% | 18.0% |
| Median | 18.0% | 13.8% |
| Interquartile 25% (IQ1) | 12.5% | 11.3% |
| Interquartile 75% (IQ3) | 36.7% | 17.6% |
| Interquartile Range (IQR) | 24.2% | 6.2% |
| Standard Deviation (Sample) | 30.2% | 18.2% |
| Standard Deviation (Population) | 29.5% | 17.8% |
Similar Demographics by Single Male Poverty
Demographics Similar to Aleuts by Single Male Poverty
In terms of single male poverty, the demographic groups most similar to Aleuts are Alaska Native (15.4%, a difference of 0.11%), Blackfeet (15.5%, a difference of 0.64%), Alsatian (15.2%, a difference of 1.0%), Pennsylvania German (15.6%, a difference of 1.1%), and Dominican (15.2%, a difference of 1.2%).
| Demographics | Rating | Rank | Single Male Poverty |
| Africans | 0.0 /100 | #296 | Tragic 14.7% |
| Immigrants | Dominican Republic | 0.0 /100 | #297 | Tragic 14.8% |
| French American Indians | 0.0 /100 | #298 | Tragic 15.0% |
| Delaware | 0.0 /100 | #299 | Tragic 15.0% |
| Cree | 0.0 /100 | #300 | Tragic 15.1% |
| Dominicans | 0.0 /100 | #301 | Tragic 15.2% |
| Alsatians | 0.0 /100 | #302 | Tragic 15.2% |
| Aleuts | 0.0 /100 | #303 | Tragic 15.4% |
| Alaska Natives | 0.0 /100 | #304 | Tragic 15.4% |
| Blackfeet | 0.0 /100 | #305 | Tragic 15.5% |
| Pennsylvania Germans | 0.0 /100 | #306 | Tragic 15.6% |
| Ute | 0.0 /100 | #307 | Tragic 15.7% |
| Potawatomi | 0.0 /100 | #308 | Tragic 15.8% |
| Americans | 0.0 /100 | #309 | Tragic 15.8% |
| Yakama | 0.0 /100 | #310 | Tragic 15.9% |
Demographics Similar to Immigrants from Zaire by Single Male Poverty
In terms of single male poverty, the demographic groups most similar to Immigrants from Zaire are Finnish (13.6%, a difference of 0.050%), Immigrants from Somalia (13.6%, a difference of 0.11%), Spanish (13.6%, a difference of 0.13%), German Russian (13.6%, a difference of 0.19%), and Czech (13.5%, a difference of 0.37%).
| Demographics | Rating | Rank | Single Male Poverty |
| Immigrants | Senegal | 1.7 /100 | #244 | Tragic 13.5% |
| Immigrants | Latin America | 1.3 /100 | #245 | Tragic 13.5% |
| Immigrants | Micronesia | 1.2 /100 | #246 | Tragic 13.5% |
| Belgians | 1.2 /100 | #247 | Tragic 13.5% |
| Czechs | 1.2 /100 | #248 | Tragic 13.5% |
| Spanish | 1.0 /100 | #249 | Tragic 13.6% |
| Immigrants | Somalia | 1.0 /100 | #250 | Tragic 13.6% |
| Immigrants | Zaire | 0.9 /100 | #251 | Tragic 13.6% |
| Finns | 0.9 /100 | #252 | Tragic 13.6% |
| German Russians | 0.8 /100 | #253 | Tragic 13.6% |
| Sub-Saharan Africans | 0.5 /100 | #254 | Tragic 13.7% |
| Spaniards | 0.4 /100 | #255 | Tragic 13.7% |
| Immigrants | Belize | 0.4 /100 | #256 | Tragic 13.7% |
| Immigrants | Central America | 0.3 /100 | #257 | Tragic 13.8% |
| Immigrants | Guatemala | 0.3 /100 | #258 | Tragic 13.8% |