Immigrants vs Immigrants from Europe Family Poverty
COMPARE
Immigrants
Immigrants from Europe
Family Poverty
Family Poverty Comparison
Immigrants
Immigrants from Europe
10.0%
FAMILY POVERTY
3.6/ 100
METRIC RATING
225th/ 347
METRIC RANK
7.9%
FAMILY POVERTY
97.8/ 100
METRIC RATING
79th/ 347
METRIC RANK
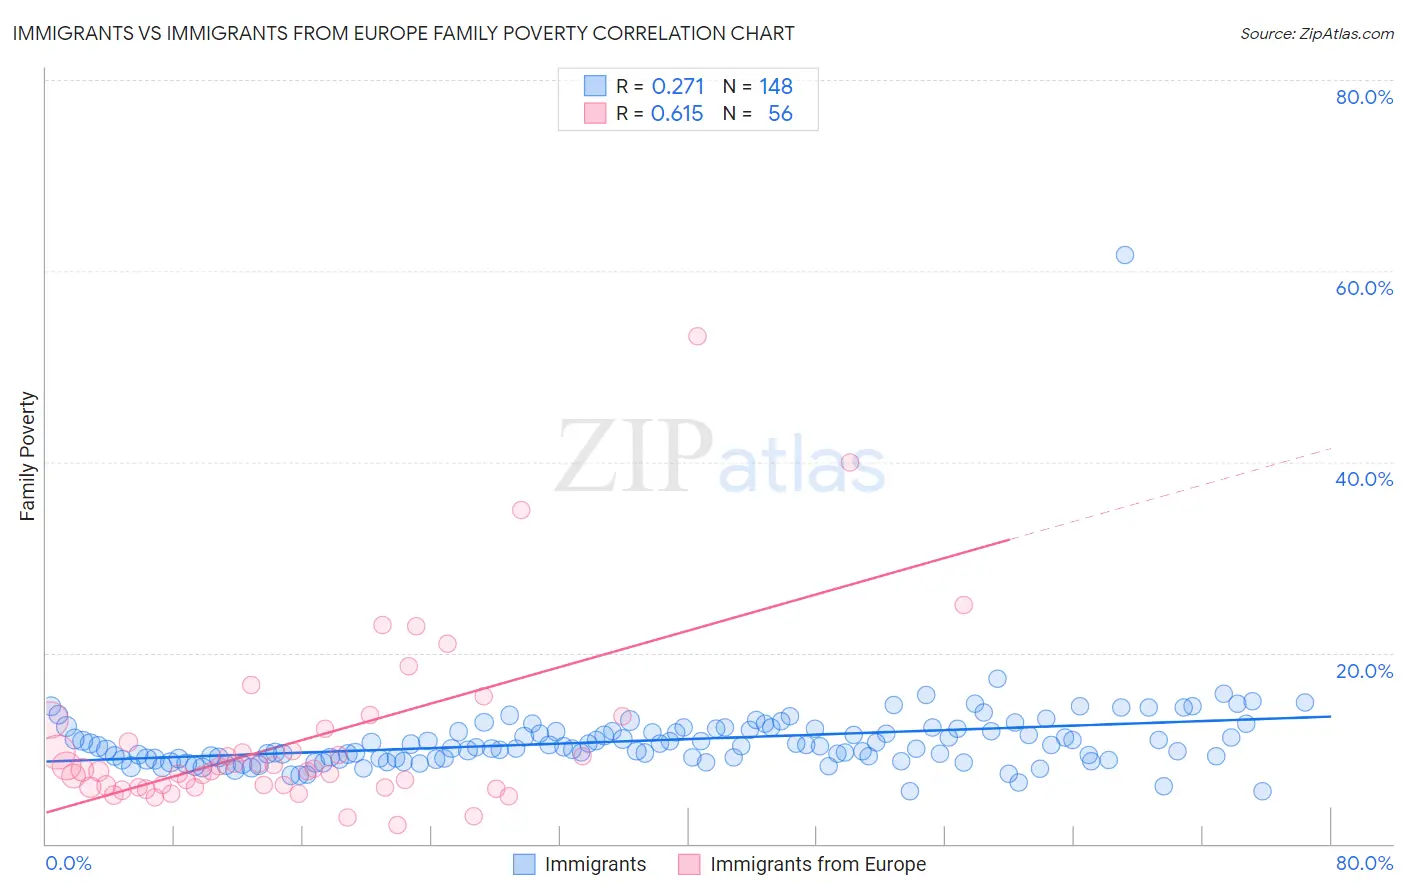
Immigrants vs Immigrants from Europe Family Poverty Correlation Chart
The statistical analysis conducted on geographies consisting of 572,663,107 people shows a weak positive correlation between the proportion of Immigrants and poverty level among families in the United States with a correlation coefficient (R) of 0.271 and weighted average of 10.0%. Similarly, the statistical analysis conducted on geographies consisting of 543,618,397 people shows a significant positive correlation between the proportion of Immigrants from Europe and poverty level among families in the United States with a correlation coefficient (R) of 0.615 and weighted average of 7.9%, a difference of 26.5%.
Family Poverty Correlation Summary
| Measurement | Immigrants | Immigrants from Europe |
| Minimum | 5.5% | 1.9% |
| Maximum | 61.7% | 53.2% |
| Range | 56.2% | 51.3% |
| Mean | 10.8% | 10.9% |
| Median | 10.2% | 7.7% |
| Interquartile 25% (IQ1) | 8.9% | 5.9% |
| Interquartile 75% (IQ3) | 11.9% | 11.3% |
| Interquartile Range (IQR) | 3.0% | 5.4% |
| Standard Deviation (Sample) | 4.7% | 9.3% |
| Standard Deviation (Population) | 4.7% | 9.2% |
Similar Demographics by Family Poverty
Demographics Similar to Immigrants by Family Poverty
In terms of family poverty, the demographic groups most similar to Immigrants are Marshallese (9.9%, a difference of 0.25%), Ottawa (10.0%, a difference of 0.27%), Immigrants from Armenia (10.0%, a difference of 0.29%), Sudanese (10.0%, a difference of 0.49%), and Immigrants from Uzbekistan (10.0%, a difference of 0.51%).
| Demographics | Rating | Rank | Family Poverty |
| Panamanians | 5.6 /100 | #218 | Tragic 9.8% |
| Immigrants | Eritrea | 5.4 /100 | #219 | Tragic 9.9% |
| Bermudans | 5.3 /100 | #220 | Tragic 9.9% |
| Immigrants | Cambodia | 4.8 /100 | #221 | Tragic 9.9% |
| Japanese | 4.8 /100 | #222 | Tragic 9.9% |
| Immigrants | Africa | 4.3 /100 | #223 | Tragic 9.9% |
| Marshallese | 3.9 /100 | #224 | Tragic 9.9% |
| Immigrants | Immigrants | 3.6 /100 | #225 | Tragic 10.0% |
| Ottawa | 3.3 /100 | #226 | Tragic 10.0% |
| Immigrants | Armenia | 3.3 /100 | #227 | Tragic 10.0% |
| Sudanese | 3.1 /100 | #228 | Tragic 10.0% |
| Immigrants | Uzbekistan | 3.1 /100 | #229 | Tragic 10.0% |
| Immigrants | Panama | 3.1 /100 | #230 | Tragic 10.0% |
| Alaskan Athabascans | 2.7 /100 | #231 | Tragic 10.1% |
| Immigrants | Sudan | 2.3 /100 | #232 | Tragic 10.1% |
Demographics Similar to Immigrants from Europe by Family Poverty
In terms of family poverty, the demographic groups most similar to Immigrants from Europe are English (7.9%, a difference of 0.060%), Irish (7.9%, a difference of 0.070%), Immigrants from North America (7.9%, a difference of 0.080%), Immigrants from Poland (7.9%, a difference of 0.090%), and Ukrainian (7.9%, a difference of 0.19%).
| Demographics | Rating | Rank | Family Poverty |
| Immigrants | Romania | 98.2 /100 | #72 | Exceptional 7.8% |
| Austrians | 98.2 /100 | #73 | Exceptional 7.8% |
| Immigrants | China | 98.1 /100 | #74 | Exceptional 7.8% |
| Immigrants | Croatia | 98.1 /100 | #75 | Exceptional 7.8% |
| Immigrants | Latvia | 98.0 /100 | #76 | Exceptional 7.9% |
| Ukrainians | 98.0 /100 | #77 | Exceptional 7.9% |
| Immigrants | North America | 97.9 /100 | #78 | Exceptional 7.9% |
| Immigrants | Europe | 97.8 /100 | #79 | Exceptional 7.9% |
| English | 97.8 /100 | #80 | Exceptional 7.9% |
| Irish | 97.8 /100 | #81 | Exceptional 7.9% |
| Immigrants | Poland | 97.8 /100 | #82 | Exceptional 7.9% |
| Slovaks | 97.7 /100 | #83 | Exceptional 7.9% |
| British | 97.5 /100 | #84 | Exceptional 7.9% |
| Immigrants | Asia | 97.4 /100 | #85 | Exceptional 7.9% |
| Scottish | 97.3 /100 | #86 | Exceptional 7.9% |