Menominee vs Immigrants from Europe Family Poverty
COMPARE
Menominee
Immigrants from Europe
Family Poverty
Family Poverty Comparison
Menominee
Immigrants from Europe
12.7%
FAMILY POVERTY
0.0/ 100
METRIC RATING
323rd/ 347
METRIC RANK
7.9%
FAMILY POVERTY
97.8/ 100
METRIC RATING
79th/ 347
METRIC RANK
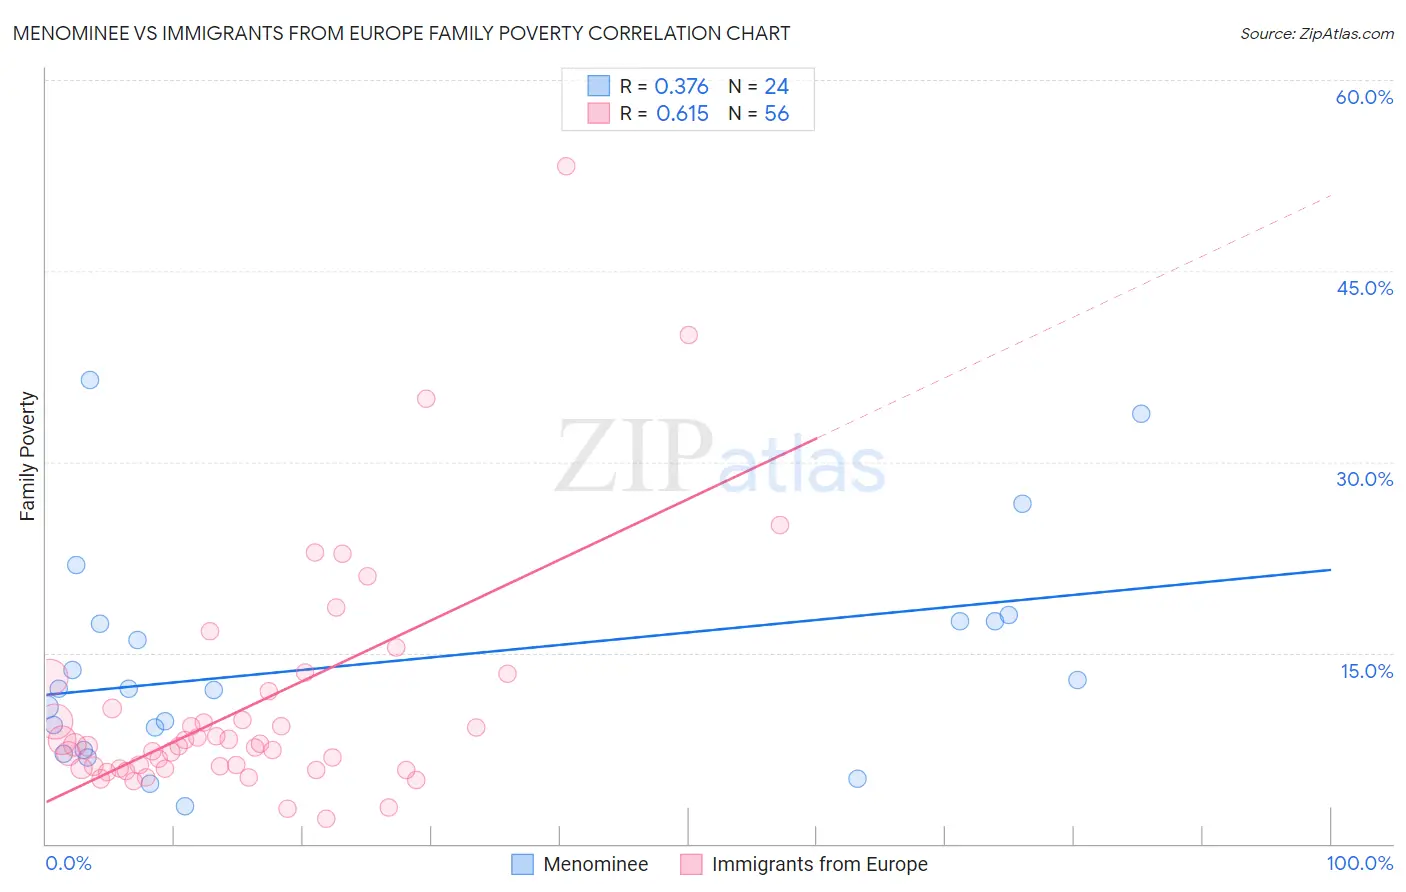
Menominee vs Immigrants from Europe Family Poverty Correlation Chart
The statistical analysis conducted on geographies consisting of 45,766,702 people shows a mild positive correlation between the proportion of Menominee and poverty level among families in the United States with a correlation coefficient (R) of 0.376 and weighted average of 12.7%. Similarly, the statistical analysis conducted on geographies consisting of 543,618,397 people shows a significant positive correlation between the proportion of Immigrants from Europe and poverty level among families in the United States with a correlation coefficient (R) of 0.615 and weighted average of 7.9%, a difference of 61.6%.
Family Poverty Correlation Summary
| Measurement | Menominee | Immigrants from Europe |
| Minimum | 2.9% | 1.9% |
| Maximum | 36.4% | 53.2% |
| Range | 33.5% | 51.3% |
| Mean | 14.2% | 10.9% |
| Median | 12.2% | 7.7% |
| Interquartile 25% (IQ1) | 8.2% | 5.9% |
| Interquartile 75% (IQ3) | 17.5% | 11.3% |
| Interquartile Range (IQR) | 9.3% | 5.4% |
| Standard Deviation (Sample) | 8.6% | 9.3% |
| Standard Deviation (Population) | 8.4% | 9.2% |
Similar Demographics by Family Poverty
Demographics Similar to Menominee by Family Poverty
In terms of family poverty, the demographic groups most similar to Menominee are Immigrants from Dominica (12.7%, a difference of 0.080%), Immigrants from Honduras (12.7%, a difference of 0.54%), Arapaho (12.7%, a difference of 0.65%), Paiute (13.0%, a difference of 2.0%), and Colville (13.0%, a difference of 2.1%).
| Demographics | Rating | Rank | Family Poverty |
| Hondurans | 0.0 /100 | #316 | Tragic 12.4% |
| Immigrants | Grenada | 0.0 /100 | #317 | Tragic 12.4% |
| U.S. Virgin Islanders | 0.0 /100 | #318 | Tragic 12.4% |
| British West Indians | 0.0 /100 | #319 | Tragic 12.4% |
| Inupiat | 0.0 /100 | #320 | Tragic 12.5% |
| Arapaho | 0.0 /100 | #321 | Tragic 12.7% |
| Immigrants | Honduras | 0.0 /100 | #322 | Tragic 12.7% |
| Menominee | 0.0 /100 | #323 | Tragic 12.7% |
| Immigrants | Dominica | 0.0 /100 | #324 | Tragic 12.7% |
| Paiute | 0.0 /100 | #325 | Tragic 13.0% |
| Colville | 0.0 /100 | #326 | Tragic 13.0% |
| Yakama | 0.0 /100 | #327 | Tragic 13.1% |
| Central American Indians | 0.0 /100 | #328 | Tragic 13.3% |
| Blacks/African Americans | 0.0 /100 | #329 | Tragic 13.3% |
| Natives/Alaskans | 0.0 /100 | #330 | Tragic 14.3% |
Demographics Similar to Immigrants from Europe by Family Poverty
In terms of family poverty, the demographic groups most similar to Immigrants from Europe are English (7.9%, a difference of 0.060%), Irish (7.9%, a difference of 0.070%), Immigrants from North America (7.9%, a difference of 0.080%), Immigrants from Poland (7.9%, a difference of 0.090%), and Ukrainian (7.9%, a difference of 0.19%).
| Demographics | Rating | Rank | Family Poverty |
| Immigrants | Romania | 98.2 /100 | #72 | Exceptional 7.8% |
| Austrians | 98.2 /100 | #73 | Exceptional 7.8% |
| Immigrants | China | 98.1 /100 | #74 | Exceptional 7.8% |
| Immigrants | Croatia | 98.1 /100 | #75 | Exceptional 7.8% |
| Immigrants | Latvia | 98.0 /100 | #76 | Exceptional 7.9% |
| Ukrainians | 98.0 /100 | #77 | Exceptional 7.9% |
| Immigrants | North America | 97.9 /100 | #78 | Exceptional 7.9% |
| Immigrants | Europe | 97.8 /100 | #79 | Exceptional 7.9% |
| English | 97.8 /100 | #80 | Exceptional 7.9% |
| Irish | 97.8 /100 | #81 | Exceptional 7.9% |
| Immigrants | Poland | 97.8 /100 | #82 | Exceptional 7.9% |
| Slovaks | 97.7 /100 | #83 | Exceptional 7.9% |
| British | 97.5 /100 | #84 | Exceptional 7.9% |
| Immigrants | Asia | 97.4 /100 | #85 | Exceptional 7.9% |
| Scottish | 97.3 /100 | #86 | Exceptional 7.9% |