Apache vs Immigrants from Europe Family Poverty
COMPARE
Apache
Immigrants from Europe
Family Poverty
Family Poverty Comparison
Apache
Immigrants from Europe
14.7%
FAMILY POVERTY
0.0/ 100
METRIC RATING
335th/ 347
METRIC RANK
7.9%
FAMILY POVERTY
97.8/ 100
METRIC RATING
79th/ 347
METRIC RANK
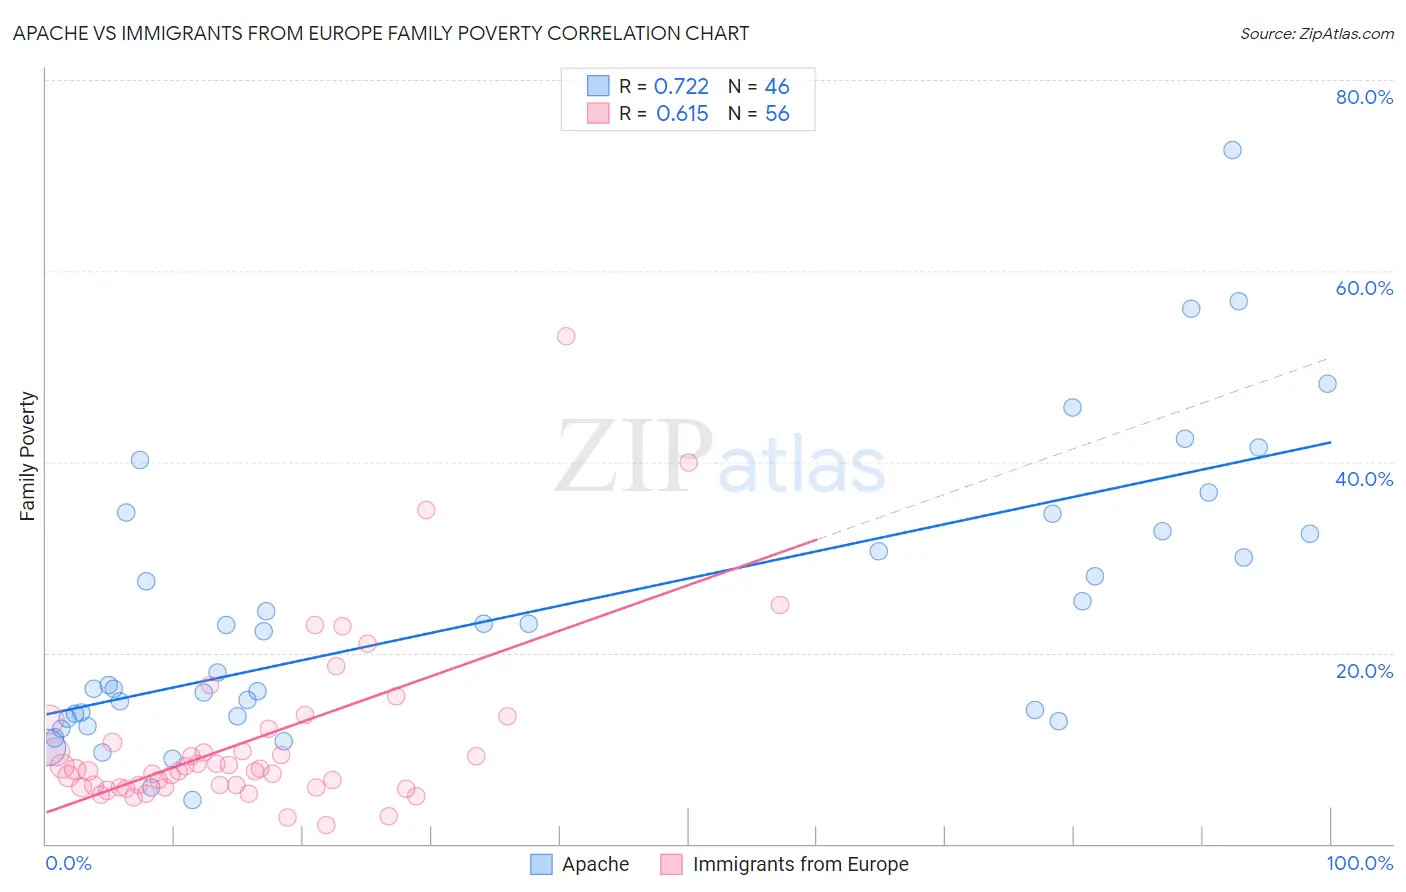
Apache vs Immigrants from Europe Family Poverty Correlation Chart
The statistical analysis conducted on geographies consisting of 230,899,358 people shows a strong positive correlation between the proportion of Apache and poverty level among families in the United States with a correlation coefficient (R) of 0.722 and weighted average of 14.7%. Similarly, the statistical analysis conducted on geographies consisting of 543,618,397 people shows a significant positive correlation between the proportion of Immigrants from Europe and poverty level among families in the United States with a correlation coefficient (R) of 0.615 and weighted average of 7.9%, a difference of 87.0%.
Family Poverty Correlation Summary
| Measurement | Apache | Immigrants from Europe |
| Minimum | 4.6% | 1.9% |
| Maximum | 72.7% | 53.2% |
| Range | 68.1% | 51.3% |
| Mean | 24.5% | 10.9% |
| Median | 20.1% | 7.7% |
| Interquartile 25% (IQ1) | 13.3% | 5.9% |
| Interquartile 75% (IQ3) | 32.7% | 11.3% |
| Interquartile Range (IQR) | 19.4% | 5.4% |
| Standard Deviation (Sample) | 15.1% | 9.3% |
| Standard Deviation (Population) | 14.9% | 9.2% |
Similar Demographics by Family Poverty
Demographics Similar to Apache by Family Poverty
In terms of family poverty, the demographic groups most similar to Apache are Houma (14.6%, a difference of 0.85%), Immigrants from Dominican Republic (14.4%, a difference of 2.1%), Dominican (14.3%, a difference of 2.8%), Cheyenne (14.3%, a difference of 3.2%), and Native/Alaskan (14.3%, a difference of 3.4%).
| Demographics | Rating | Rank | Family Poverty |
| Central American Indians | 0.0 /100 | #328 | Tragic 13.3% |
| Blacks/African Americans | 0.0 /100 | #329 | Tragic 13.3% |
| Natives/Alaskans | 0.0 /100 | #330 | Tragic 14.3% |
| Cheyenne | 0.0 /100 | #331 | Tragic 14.3% |
| Dominicans | 0.0 /100 | #332 | Tragic 14.3% |
| Immigrants | Dominican Republic | 0.0 /100 | #333 | Tragic 14.4% |
| Houma | 0.0 /100 | #334 | Tragic 14.6% |
| Apache | 0.0 /100 | #335 | Tragic 14.7% |
| Sioux | 0.0 /100 | #336 | Tragic 15.9% |
| Hopi | 0.0 /100 | #337 | Tragic 15.9% |
| Crow | 0.0 /100 | #338 | Tragic 16.1% |
| Yuman | 0.0 /100 | #339 | Tragic 16.6% |
| Pueblo | 0.0 /100 | #340 | Tragic 17.0% |
| Lumbee | 0.0 /100 | #341 | Tragic 17.0% |
| Immigrants | Yemen | 0.0 /100 | #342 | Tragic 17.5% |
Demographics Similar to Immigrants from Europe by Family Poverty
In terms of family poverty, the demographic groups most similar to Immigrants from Europe are English (7.9%, a difference of 0.060%), Irish (7.9%, a difference of 0.070%), Immigrants from North America (7.9%, a difference of 0.080%), Immigrants from Poland (7.9%, a difference of 0.090%), and Ukrainian (7.9%, a difference of 0.19%).
| Demographics | Rating | Rank | Family Poverty |
| Immigrants | Romania | 98.2 /100 | #72 | Exceptional 7.8% |
| Austrians | 98.2 /100 | #73 | Exceptional 7.8% |
| Immigrants | China | 98.1 /100 | #74 | Exceptional 7.8% |
| Immigrants | Croatia | 98.1 /100 | #75 | Exceptional 7.8% |
| Immigrants | Latvia | 98.0 /100 | #76 | Exceptional 7.9% |
| Ukrainians | 98.0 /100 | #77 | Exceptional 7.9% |
| Immigrants | North America | 97.9 /100 | #78 | Exceptional 7.9% |
| Immigrants | Europe | 97.8 /100 | #79 | Exceptional 7.9% |
| English | 97.8 /100 | #80 | Exceptional 7.9% |
| Irish | 97.8 /100 | #81 | Exceptional 7.9% |
| Immigrants | Poland | 97.8 /100 | #82 | Exceptional 7.9% |
| Slovaks | 97.7 /100 | #83 | Exceptional 7.9% |
| British | 97.5 /100 | #84 | Exceptional 7.9% |
| Immigrants | Asia | 97.4 /100 | #85 | Exceptional 7.9% |
| Scottish | 97.3 /100 | #86 | Exceptional 7.9% |