Ute vs Belgian Male Unemployment
COMPARE
Ute
Belgian
Male Unemployment
Male Unemployment Comparison
Ute
Belgians
6.6%
MALE UNEMPLOYMENT
0.0/ 100
METRIC RATING
302nd/ 347
METRIC RANK
4.8%
MALE UNEMPLOYMENT
99.9/ 100
METRIC RATING
27th/ 347
METRIC RANK
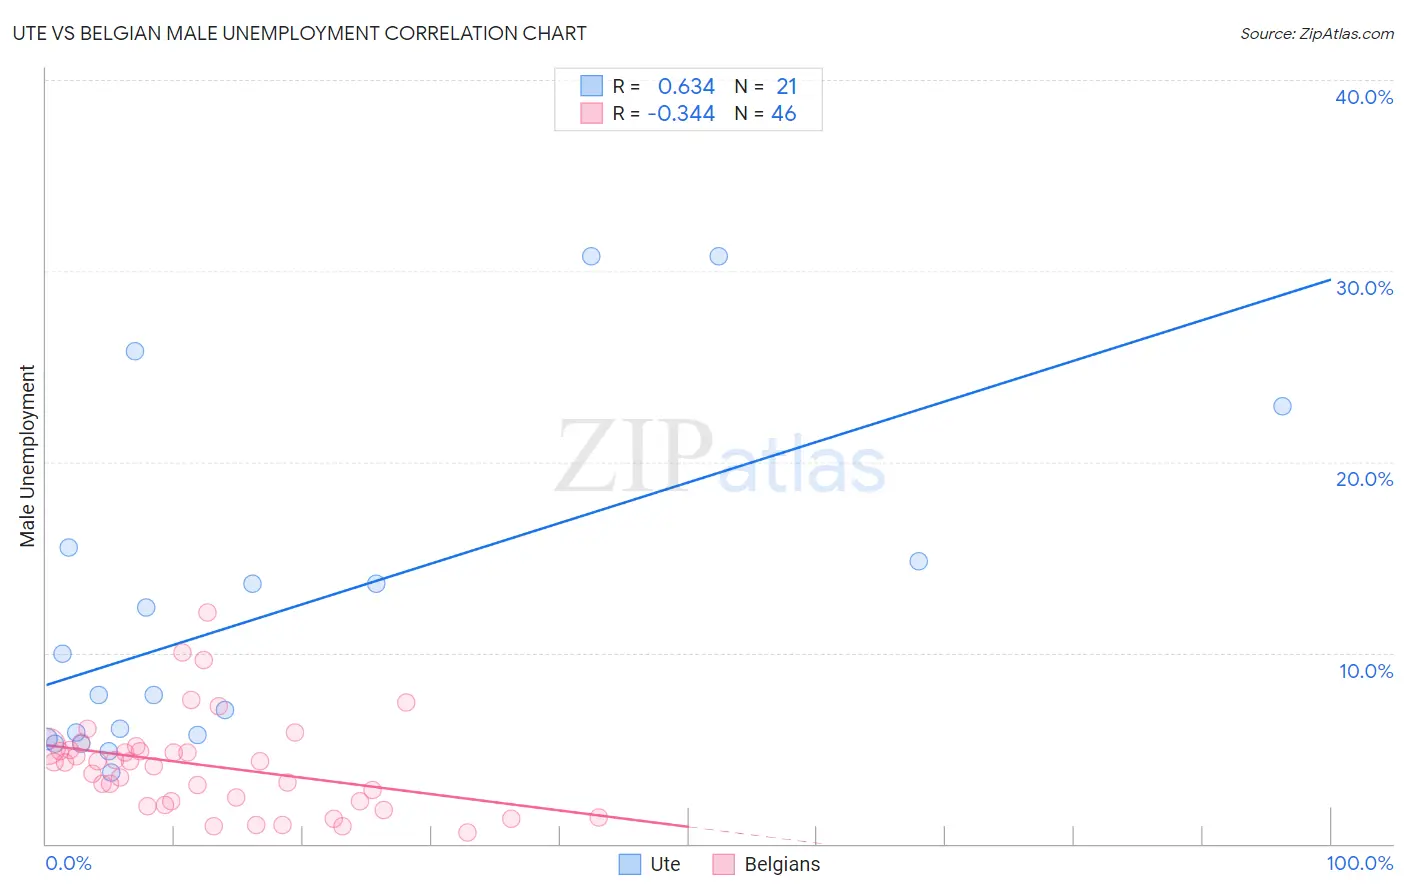
Ute vs Belgian Male Unemployment Correlation Chart
The statistical analysis conducted on geographies consisting of 55,563,809 people shows a significant positive correlation between the proportion of Ute and unemployment rate among males in the United States with a correlation coefficient (R) of 0.634 and weighted average of 6.6%. Similarly, the statistical analysis conducted on geographies consisting of 354,096,241 people shows a mild negative correlation between the proportion of Belgians and unemployment rate among males in the United States with a correlation coefficient (R) of -0.344 and weighted average of 4.8%, a difference of 38.6%.
Male Unemployment Correlation Summary
| Measurement | Ute | Belgian |
| Minimum | 3.7% | 0.60% |
| Maximum | 30.8% | 12.1% |
| Range | 27.1% | 11.5% |
| Mean | 12.1% | 4.1% |
| Median | 7.8% | 4.3% |
| Interquartile 25% (IQ1) | 5.6% | 2.2% |
| Interquartile 75% (IQ3) | 15.2% | 4.9% |
| Interquartile Range (IQR) | 9.6% | 2.7% |
| Standard Deviation (Sample) | 8.6% | 2.5% |
| Standard Deviation (Population) | 8.4% | 2.5% |
Similar Demographics by Male Unemployment
Demographics Similar to Ute by Male Unemployment
In terms of male unemployment, the demographic groups most similar to Ute are Immigrants from West Indies (6.7%, a difference of 0.36%), West Indian (6.7%, a difference of 0.37%), Trinidadian and Tobagonian (6.7%, a difference of 0.69%), Immigrants from Belize (6.6%, a difference of 0.71%), and Vietnamese (6.6%, a difference of 0.82%).
| Demographics | Rating | Rank | Male Unemployment |
| Belizeans | 0.0 /100 | #295 | Tragic 6.5% |
| Immigrants | Haiti | 0.0 /100 | #296 | Tragic 6.5% |
| Chippewa | 0.0 /100 | #297 | Tragic 6.6% |
| Jamaicans | 0.0 /100 | #298 | Tragic 6.6% |
| Immigrants | Bangladesh | 0.0 /100 | #299 | Tragic 6.6% |
| Vietnamese | 0.0 /100 | #300 | Tragic 6.6% |
| Immigrants | Belize | 0.0 /100 | #301 | Tragic 6.6% |
| Ute | 0.0 /100 | #302 | Tragic 6.6% |
| Immigrants | West Indies | 0.0 /100 | #303 | Tragic 6.7% |
| West Indians | 0.0 /100 | #304 | Tragic 6.7% |
| Trinidadians and Tobagonians | 0.0 /100 | #305 | Tragic 6.7% |
| Immigrants | Trinidad and Tobago | 0.0 /100 | #306 | Tragic 6.7% |
| Immigrants | Jamaica | 0.0 /100 | #307 | Tragic 6.7% |
| Aleuts | 0.0 /100 | #308 | Tragic 6.8% |
| Barbadians | 0.0 /100 | #309 | Tragic 6.9% |
Demographics Similar to Belgians by Male Unemployment
In terms of male unemployment, the demographic groups most similar to Belgians are Bulgarian (4.8%, a difference of 0.18%), Dutch (4.8%, a difference of 0.20%), Zimbabwean (4.8%, a difference of 0.22%), Immigrants from South Central Asia (4.8%, a difference of 0.32%), and Scottish (4.8%, a difference of 0.32%).
| Demographics | Rating | Rank | Male Unemployment |
| Pennsylvania Germans | 99.9 /100 | #20 | Exceptional 4.8% |
| Immigrants | Taiwan | 99.9 /100 | #21 | Exceptional 4.8% |
| Carpatho Rusyns | 99.9 /100 | #22 | Exceptional 4.8% |
| Tongans | 99.9 /100 | #23 | Exceptional 4.8% |
| Immigrants | South Central Asia | 99.9 /100 | #24 | Exceptional 4.8% |
| Zimbabweans | 99.9 /100 | #25 | Exceptional 4.8% |
| Dutch | 99.9 /100 | #26 | Exceptional 4.8% |
| Belgians | 99.9 /100 | #27 | Exceptional 4.8% |
| Bulgarians | 99.8 /100 | #28 | Exceptional 4.8% |
| Scottish | 99.8 /100 | #29 | Exceptional 4.8% |
| British | 99.8 /100 | #30 | Exceptional 4.8% |
| Sudanese | 99.8 /100 | #31 | Exceptional 4.8% |
| Immigrants | Nepal | 99.8 /100 | #32 | Exceptional 4.8% |
| Latvians | 99.7 /100 | #33 | Exceptional 4.8% |
| Welsh | 99.7 /100 | #34 | Exceptional 4.8% |