Ute vs Belgian Divorced or Separated
COMPARE
Ute
Belgian
Divorced or Separated
Divorced or Separated Comparison
Ute
Belgians
12.6%
DIVORCED OR SEPARATED
0.4/ 100
METRIC RATING
270th/ 347
METRIC RANK
12.3%
DIVORCED OR SEPARATED
9.7/ 100
METRIC RATING
225th/ 347
METRIC RANK
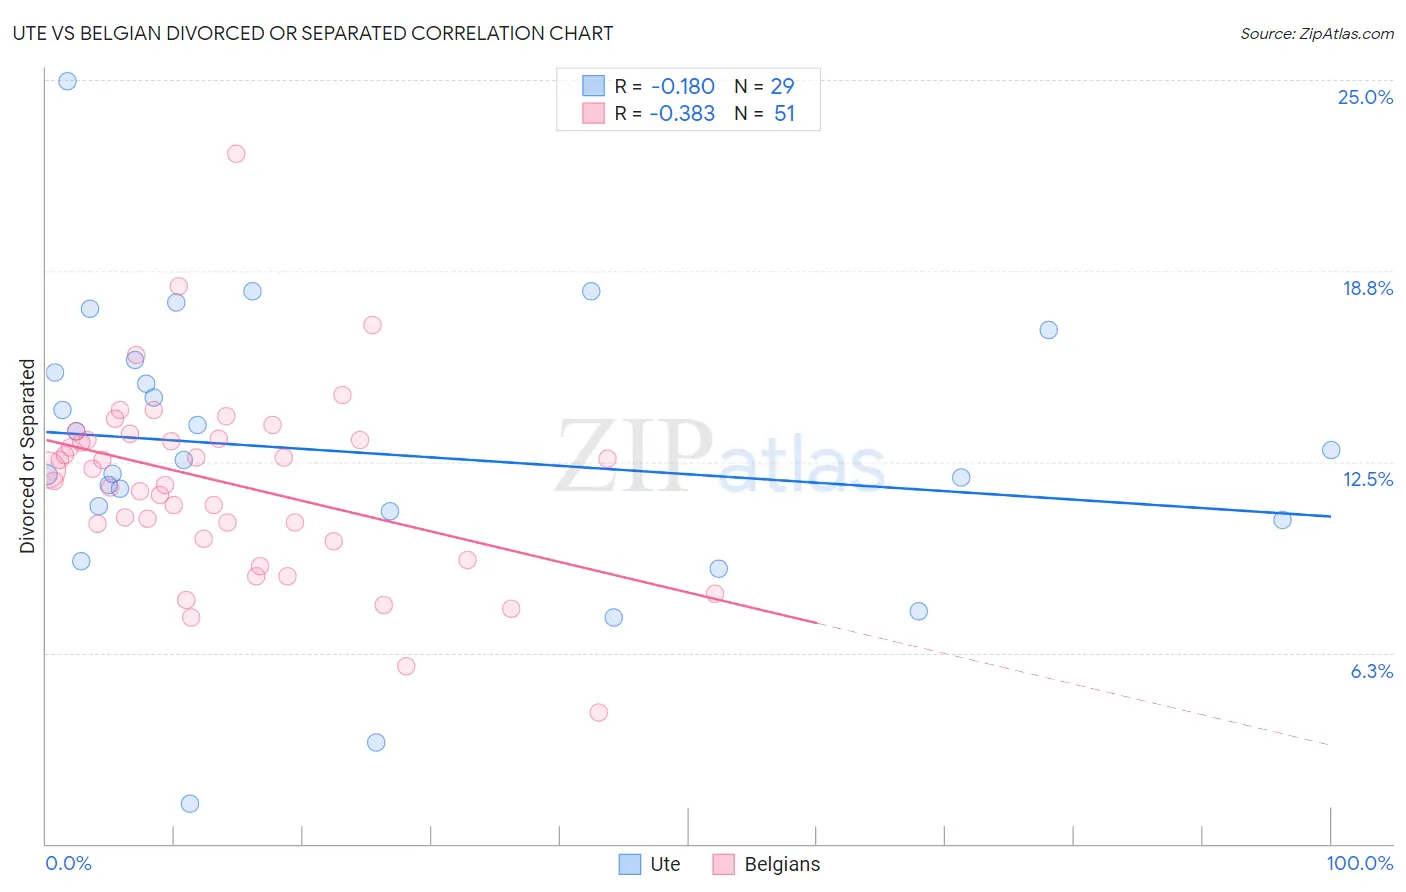
Ute vs Belgian Divorced or Separated Correlation Chart
The statistical analysis conducted on geographies consisting of 55,667,313 people shows a poor negative correlation between the proportion of Ute and percentage of population currently divorced or separated in the United States with a correlation coefficient (R) of -0.180 and weighted average of 12.6%. Similarly, the statistical analysis conducted on geographies consisting of 355,900,464 people shows a mild negative correlation between the proportion of Belgians and percentage of population currently divorced or separated in the United States with a correlation coefficient (R) of -0.383 and weighted average of 12.3%, a difference of 2.9%.
Divorced or Separated Correlation Summary
| Measurement | Ute | Belgian |
| Minimum | 1.3% | 4.3% |
| Maximum | 24.9% | 22.6% |
| Range | 23.6% | 18.3% |
| Mean | 12.8% | 11.8% |
| Median | 12.6% | 12.2% |
| Interquartile 25% (IQ1) | 10.7% | 10.0% |
| Interquartile 75% (IQ3) | 15.6% | 13.2% |
| Interquartile Range (IQR) | 4.9% | 3.3% |
| Standard Deviation (Sample) | 4.7% | 3.1% |
| Standard Deviation (Population) | 4.6% | 3.1% |
Similar Demographics by Divorced or Separated
Demographics Similar to Ute by Divorced or Separated
In terms of divorced or separated, the demographic groups most similar to Ute are Panamanian (12.7%, a difference of 0.060%), Immigrants from Middle Africa (12.7%, a difference of 0.11%), Immigrants from Liberia (12.6%, a difference of 0.12%), Fijian (12.6%, a difference of 0.13%), and Scottish (12.6%, a difference of 0.14%).
| Demographics | Rating | Rank | Divorced or Separated |
| Immigrants | Panama | 0.5 /100 | #263 | Tragic 12.6% |
| English | 0.5 /100 | #264 | Tragic 12.6% |
| Immigrants | Senegal | 0.5 /100 | #265 | Tragic 12.6% |
| Whites/Caucasians | 0.5 /100 | #266 | Tragic 12.6% |
| Scottish | 0.4 /100 | #267 | Tragic 12.6% |
| Fijians | 0.4 /100 | #268 | Tragic 12.6% |
| Immigrants | Liberia | 0.4 /100 | #269 | Tragic 12.6% |
| Ute | 0.4 /100 | #270 | Tragic 12.6% |
| Panamanians | 0.3 /100 | #271 | Tragic 12.7% |
| Immigrants | Middle Africa | 0.3 /100 | #272 | Tragic 12.7% |
| Immigrants | Micronesia | 0.3 /100 | #273 | Tragic 12.7% |
| Bermudans | 0.3 /100 | #274 | Tragic 12.7% |
| Central American Indians | 0.3 /100 | #275 | Tragic 12.7% |
| Spaniards | 0.2 /100 | #276 | Tragic 12.7% |
| Dominicans | 0.2 /100 | #277 | Tragic 12.7% |
Demographics Similar to Belgians by Divorced or Separated
In terms of divorced or separated, the demographic groups most similar to Belgians are Immigrants from the Azores (12.3%, a difference of 0.0%), Immigrants from Western Africa (12.3%, a difference of 0.030%), Scandinavian (12.3%, a difference of 0.070%), Bangladeshi (12.3%, a difference of 0.080%), and Hmong (12.3%, a difference of 0.090%).
| Demographics | Rating | Rank | Divorced or Separated |
| Slovenes | 13.2 /100 | #218 | Poor 12.3% |
| Czechoslovakians | 11.7 /100 | #219 | Poor 12.3% |
| British | 11.6 /100 | #220 | Poor 12.3% |
| Guamanians/Chamorros | 11.3 /100 | #221 | Poor 12.3% |
| Bangladeshis | 10.5 /100 | #222 | Poor 12.3% |
| Scandinavians | 10.4 /100 | #223 | Poor 12.3% |
| Immigrants | Azores | 9.7 /100 | #224 | Tragic 12.3% |
| Belgians | 9.7 /100 | #225 | Tragic 12.3% |
| Immigrants | Western Africa | 9.3 /100 | #226 | Tragic 12.3% |
| Hmong | 8.8 /100 | #227 | Tragic 12.3% |
| Immigrants | Cameroon | 8.3 /100 | #228 | Tragic 12.3% |
| Immigrants | Sudan | 8.2 /100 | #229 | Tragic 12.3% |
| Yakama | 7.8 /100 | #230 | Tragic 12.3% |
| Yugoslavians | 6.6 /100 | #231 | Tragic 12.3% |
| Canadians | 5.3 /100 | #232 | Tragic 12.4% |