Immigrants from Latvia vs Belgian Child Poverty Among Girls Under 16
COMPARE
Immigrants from Latvia
Belgian
Child Poverty Among Girls Under 16
Child Poverty Among Girls Under 16 Comparison
Immigrants from Latvia
Belgians
14.9%
CHILD POVERTY AMONG GIRLS UNDER 16
96.1/ 100
METRIC RATING
97th/ 347
METRIC RANK
15.2%
CHILD POVERTY AMONG GIRLS UNDER 16
93.9/ 100
METRIC RATING
115th/ 347
METRIC RANK
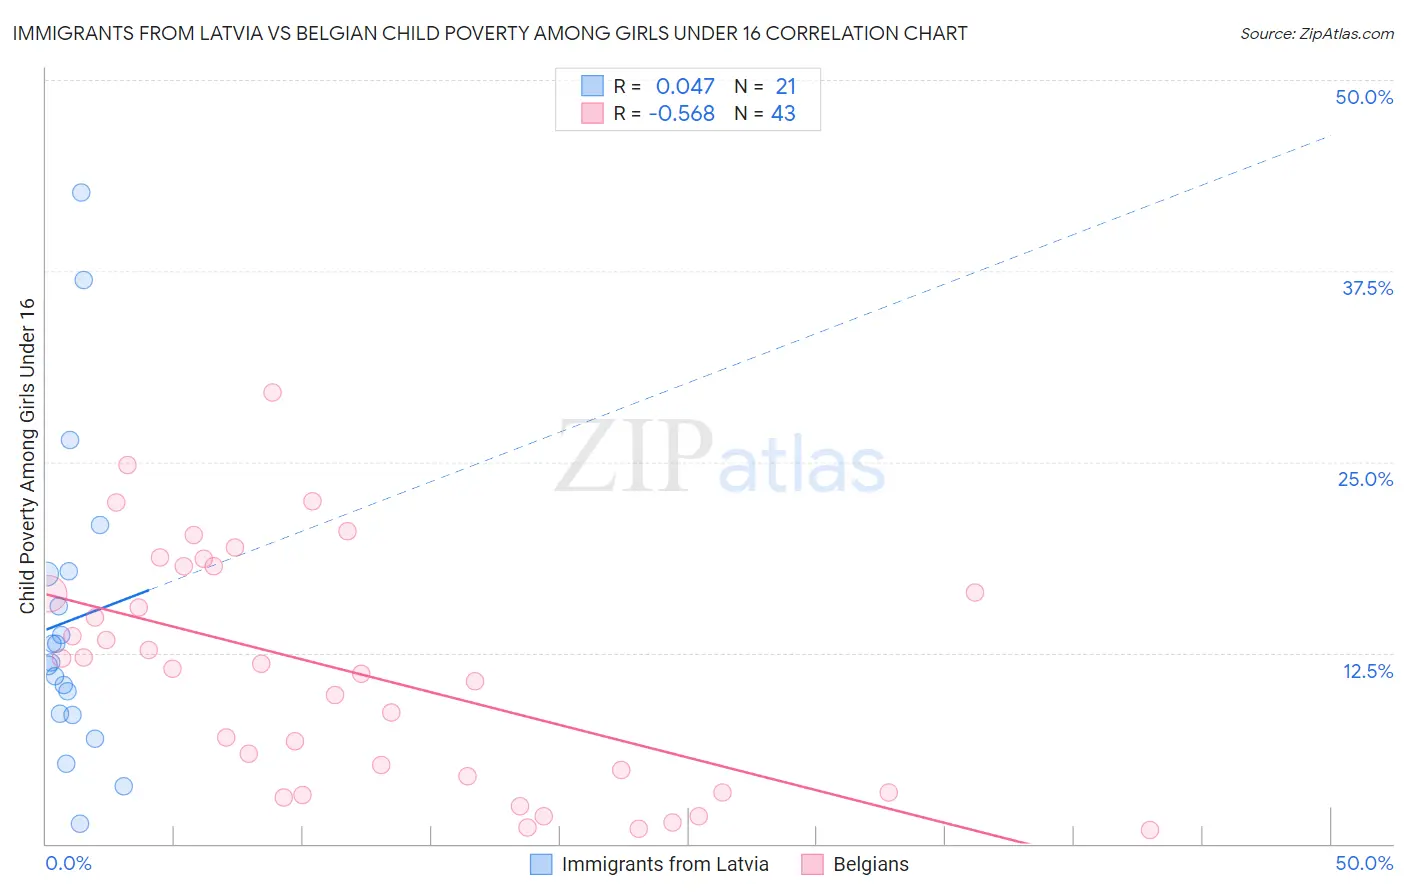
Immigrants from Latvia vs Belgian Child Poverty Among Girls Under 16 Correlation Chart
The statistical analysis conducted on geographies consisting of 112,633,349 people shows no correlation between the proportion of Immigrants from Latvia and poverty level among girls under the age of 16 in the United States with a correlation coefficient (R) of 0.047 and weighted average of 14.9%. Similarly, the statistical analysis conducted on geographies consisting of 348,783,790 people shows a substantial negative correlation between the proportion of Belgians and poverty level among girls under the age of 16 in the United States with a correlation coefficient (R) of -0.568 and weighted average of 15.2%, a difference of 1.5%.
Child Poverty Among Girls Under 16 Correlation Summary
| Measurement | Immigrants from Latvia | Belgian |
| Minimum | 1.3% | 0.93% |
| Maximum | 42.7% | 29.6% |
| Range | 41.4% | 28.6% |
| Mean | 14.6% | 11.2% |
| Median | 11.9% | 11.4% |
| Interquartile 25% (IQ1) | 8.5% | 3.4% |
| Interquartile 75% (IQ3) | 17.7% | 18.2% |
| Interquartile Range (IQR) | 9.3% | 14.8% |
| Standard Deviation (Sample) | 10.2% | 7.6% |
| Standard Deviation (Population) | 9.9% | 7.5% |
Demographics Similar to Immigrants from Latvia and Belgians by Child Poverty Among Girls Under 16
In terms of child poverty among girls under 16, the demographic groups most similar to Immigrants from Latvia are Immigrants from France (14.9%, a difference of 0.090%), Basque (15.0%, a difference of 0.19%), Immigrants from Egypt (15.0%, a difference of 0.34%), Paraguayan (15.0%, a difference of 0.38%), and Immigrants from South Africa (15.0%, a difference of 0.41%). Similarly, the demographic groups most similar to Belgians are Sri Lankan (15.2%, a difference of 0.060%), Dutch (15.1%, a difference of 0.19%), Immigrants from Kazakhstan (15.1%, a difference of 0.21%), Immigrants from Denmark (15.2%, a difference of 0.31%), and Palestinian (15.1%, a difference of 0.35%).
| Demographics | Rating | Rank | Child Poverty Among Girls Under 16 |
| Immigrants | France | 96.2 /100 | #96 | Exceptional 14.9% |
| Immigrants | Latvia | 96.1 /100 | #97 | Exceptional 14.9% |
| Basques | 95.9 /100 | #98 | Exceptional 15.0% |
| Immigrants | Egypt | 95.7 /100 | #99 | Exceptional 15.0% |
| Paraguayans | 95.7 /100 | #100 | Exceptional 15.0% |
| Immigrants | South Africa | 95.6 /100 | #101 | Exceptional 15.0% |
| Immigrants | Malaysia | 95.6 /100 | #102 | Exceptional 15.0% |
| British | 95.6 /100 | #103 | Exceptional 15.0% |
| Romanians | 95.3 /100 | #104 | Exceptional 15.0% |
| Immigrants | England | 95.1 /100 | #105 | Exceptional 15.1% |
| Chileans | 95.1 /100 | #106 | Exceptional 15.1% |
| Immigrants | Ukraine | 95.0 /100 | #107 | Exceptional 15.1% |
| Immigrants | Brazil | 94.9 /100 | #108 | Exceptional 15.1% |
| Serbians | 94.8 /100 | #109 | Exceptional 15.1% |
| Immigrants | Croatia | 94.6 /100 | #110 | Exceptional 15.1% |
| Palestinians | 94.5 /100 | #111 | Exceptional 15.1% |
| Immigrants | Kazakhstan | 94.3 /100 | #112 | Exceptional 15.1% |
| Dutch | 94.3 /100 | #113 | Exceptional 15.1% |
| Sri Lankans | 94.0 /100 | #114 | Exceptional 15.2% |
| Belgians | 93.9 /100 | #115 | Exceptional 15.2% |
| Immigrants | Denmark | 93.3 /100 | #116 | Exceptional 15.2% |