Immigrants from South Africa vs Bangladeshi Single Female Poverty
COMPARE
Immigrants from South Africa
Bangladeshi
Single Female Poverty
Single Female Poverty Comparison
Immigrants from South Africa
Bangladeshis
20.1%
SINGLE FEMALE POVERTY
93.9/ 100
METRIC RATING
125th/ 347
METRIC RANK
24.2%
SINGLE FEMALE POVERTY
0.0/ 100
METRIC RATING
287th/ 347
METRIC RANK
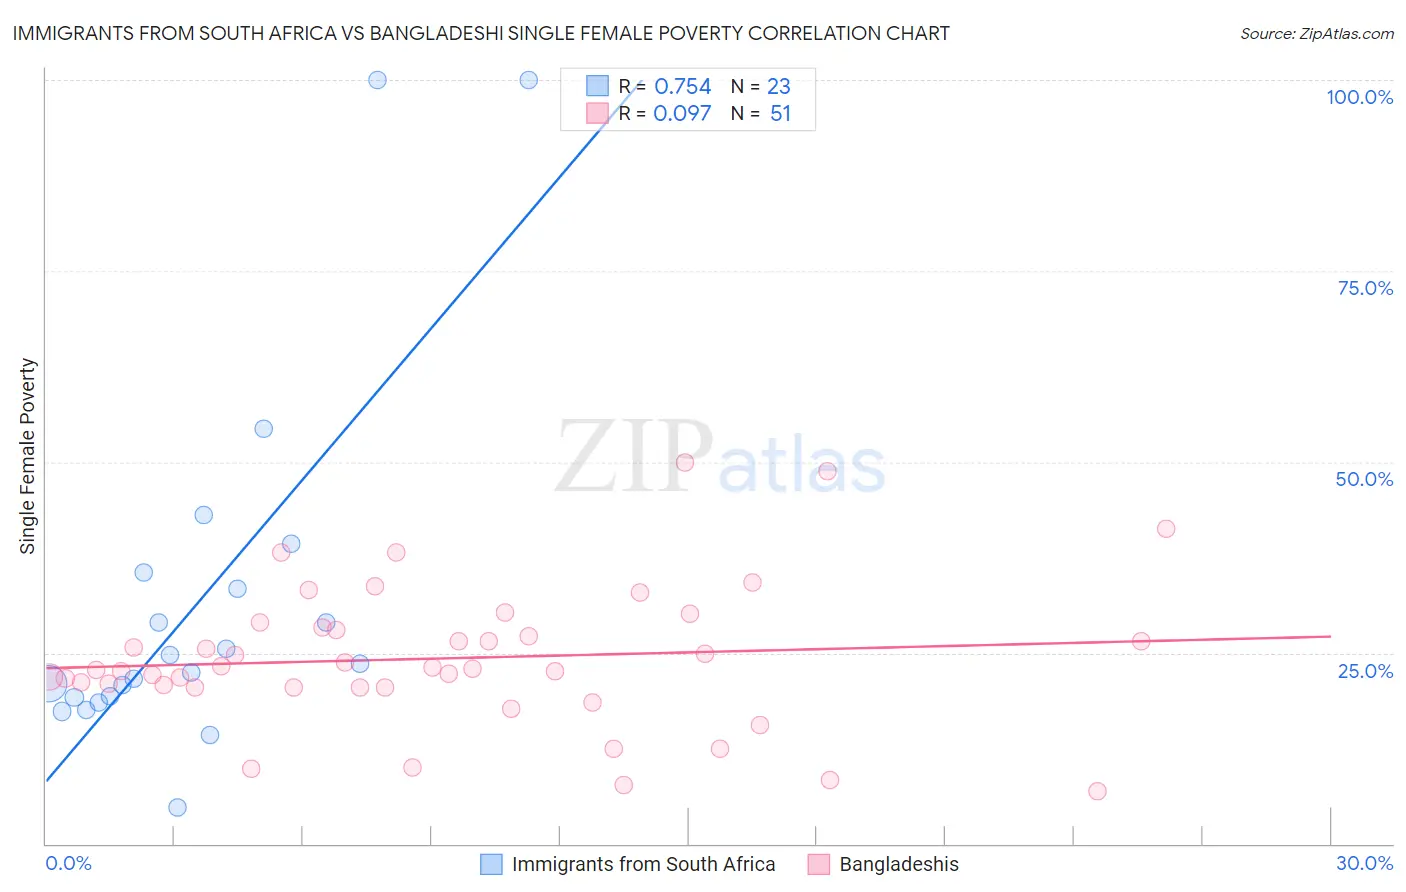
Immigrants from South Africa vs Bangladeshi Single Female Poverty Correlation Chart
The statistical analysis conducted on geographies consisting of 230,419,478 people shows a strong positive correlation between the proportion of Immigrants from South Africa and poverty level among single females in the United States with a correlation coefficient (R) of 0.754 and weighted average of 20.1%. Similarly, the statistical analysis conducted on geographies consisting of 140,594,140 people shows a slight positive correlation between the proportion of Bangladeshis and poverty level among single females in the United States with a correlation coefficient (R) of 0.097 and weighted average of 24.2%, a difference of 20.1%.
Single Female Poverty Correlation Summary
| Measurement | Immigrants from South Africa | Bangladeshi |
| Minimum | 4.7% | 6.9% |
| Maximum | 100.0% | 50.0% |
| Range | 95.3% | 43.1% |
| Mean | 31.9% | 24.3% |
| Median | 23.5% | 22.9% |
| Interquartile 25% (IQ1) | 19.1% | 20.5% |
| Interquartile 75% (IQ3) | 35.4% | 28.3% |
| Interquartile Range (IQR) | 16.3% | 7.8% |
| Standard Deviation (Sample) | 23.9% | 9.2% |
| Standard Deviation (Population) | 23.4% | 9.1% |
Similar Demographics by Single Female Poverty
Demographics Similar to Immigrants from South Africa by Single Female Poverty
In terms of single female poverty, the demographic groups most similar to Immigrants from South Africa are Immigrants from Chile (20.1%, a difference of 0.12%), Brazilian (20.1%, a difference of 0.15%), Serbian (20.1%, a difference of 0.17%), Mongolian (20.2%, a difference of 0.19%), and Immigrants from Spain (20.2%, a difference of 0.31%).
| Demographics | Rating | Rank | Single Female Poverty |
| Immigrants | Afghanistan | 95.4 /100 | #118 | Exceptional 20.0% |
| Immigrants | Ethiopia | 95.4 /100 | #119 | Exceptional 20.0% |
| South Americans | 95.1 /100 | #120 | Exceptional 20.0% |
| Immigrants | Switzerland | 95.1 /100 | #121 | Exceptional 20.0% |
| Immigrants | South America | 95.0 /100 | #122 | Exceptional 20.0% |
| Brazilians | 94.4 /100 | #123 | Exceptional 20.1% |
| Immigrants | Chile | 94.3 /100 | #124 | Exceptional 20.1% |
| Immigrants | South Africa | 93.9 /100 | #125 | Exceptional 20.1% |
| Serbians | 93.3 /100 | #126 | Exceptional 20.1% |
| Mongolians | 93.2 /100 | #127 | Exceptional 20.2% |
| Immigrants | Spain | 92.7 /100 | #128 | Exceptional 20.2% |
| Immigrants | Morocco | 92.4 /100 | #129 | Exceptional 20.2% |
| Immigrants | Hungary | 92.3 /100 | #130 | Exceptional 20.2% |
| Pakistanis | 92.1 /100 | #131 | Exceptional 20.2% |
| Uruguayans | 92.1 /100 | #132 | Exceptional 20.2% |
Demographics Similar to Bangladeshis by Single Female Poverty
In terms of single female poverty, the demographic groups most similar to Bangladeshis are Spanish American (24.2%, a difference of 0.020%), U.S. Virgin Islander (24.2%, a difference of 0.070%), Cree (24.1%, a difference of 0.15%), Immigrants from Guatemala (24.1%, a difference of 0.19%), and Indonesian (24.3%, a difference of 0.41%).
| Demographics | Rating | Rank | Single Female Poverty |
| Immigrants | Latin America | 0.0 /100 | #280 | Tragic 23.7% |
| Immigrants | Zaire | 0.0 /100 | #281 | Tragic 23.8% |
| Guatemalans | 0.0 /100 | #282 | Tragic 23.8% |
| German Russians | 0.0 /100 | #283 | Tragic 23.9% |
| Immigrants | Dominica | 0.0 /100 | #284 | Tragic 23.9% |
| Immigrants | Guatemala | 0.0 /100 | #285 | Tragic 24.1% |
| Cree | 0.0 /100 | #286 | Tragic 24.1% |
| Bangladeshis | 0.0 /100 | #287 | Tragic 24.2% |
| Spanish Americans | 0.0 /100 | #288 | Tragic 24.2% |
| U.S. Virgin Islanders | 0.0 /100 | #289 | Tragic 24.2% |
| Indonesians | 0.0 /100 | #290 | Tragic 24.3% |
| Osage | 0.0 /100 | #291 | Tragic 24.4% |
| Alsatians | 0.0 /100 | #292 | Tragic 24.5% |
| Americans | 0.0 /100 | #293 | Tragic 24.5% |
| French American Indians | 0.0 /100 | #294 | Tragic 24.6% |