Colombian vs Bangladeshi Single Female Poverty
COMPARE
Colombian
Bangladeshi
Single Female Poverty
Single Female Poverty Comparison
Colombians
Bangladeshis
19.9%
SINGLE FEMALE POVERTY
96.6/ 100
METRIC RATING
109th/ 347
METRIC RANK
24.2%
SINGLE FEMALE POVERTY
0.0/ 100
METRIC RATING
287th/ 347
METRIC RANK
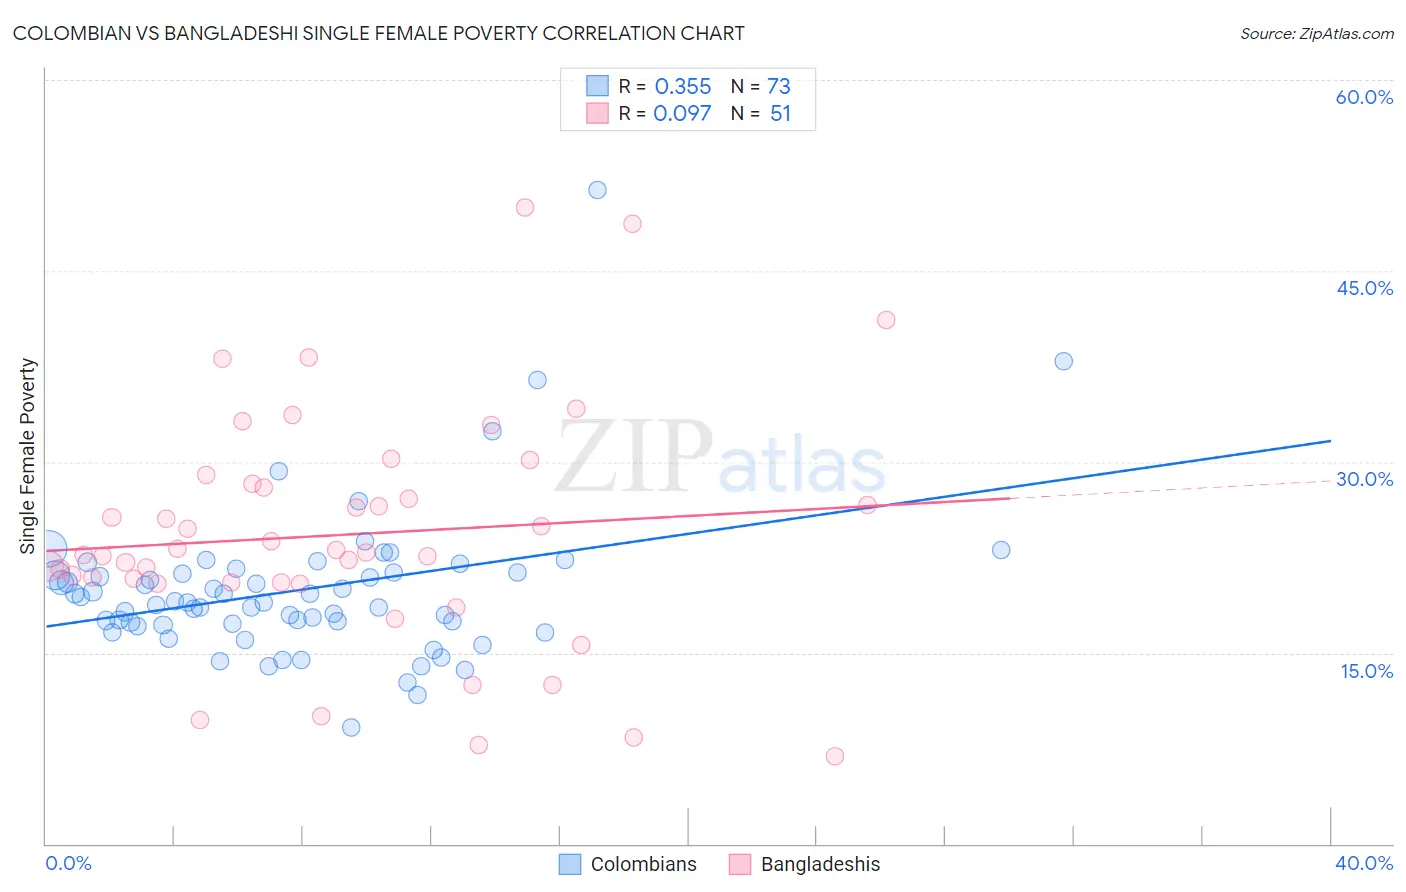
Colombian vs Bangladeshi Single Female Poverty Correlation Chart
The statistical analysis conducted on geographies consisting of 412,800,850 people shows a mild positive correlation between the proportion of Colombians and poverty level among single females in the United States with a correlation coefficient (R) of 0.355 and weighted average of 19.9%. Similarly, the statistical analysis conducted on geographies consisting of 140,594,140 people shows a slight positive correlation between the proportion of Bangladeshis and poverty level among single females in the United States with a correlation coefficient (R) of 0.097 and weighted average of 24.2%, a difference of 21.3%.
Single Female Poverty Correlation Summary
| Measurement | Colombian | Bangladeshi |
| Minimum | 9.2% | 6.9% |
| Maximum | 51.3% | 50.0% |
| Range | 42.2% | 43.1% |
| Mean | 19.9% | 24.3% |
| Median | 19.0% | 22.9% |
| Interquartile 25% (IQ1) | 17.2% | 20.5% |
| Interquartile 75% (IQ3) | 21.3% | 28.3% |
| Interquartile Range (IQR) | 4.1% | 7.8% |
| Standard Deviation (Sample) | 6.0% | 9.2% |
| Standard Deviation (Population) | 6.0% | 9.1% |
Similar Demographics by Single Female Poverty
Demographics Similar to Colombians by Single Female Poverty
In terms of single female poverty, the demographic groups most similar to Colombians are Native Hawaiian (19.9%, a difference of 0.0%), Immigrants from Western Asia (19.9%, a difference of 0.010%), Immigrants from Syria (19.9%, a difference of 0.060%), Ethiopian (19.9%, a difference of 0.070%), and Israeli (19.9%, a difference of 0.17%).
| Demographics | Rating | Rank | Single Female Poverty |
| Immigrants | Cameroon | 97.3 /100 | #102 | Exceptional 19.8% |
| Immigrants | Southern Europe | 97.1 /100 | #103 | Exceptional 19.9% |
| Chileans | 96.9 /100 | #104 | Exceptional 19.9% |
| Israelis | 96.9 /100 | #105 | Exceptional 19.9% |
| Ethiopians | 96.7 /100 | #106 | Exceptional 19.9% |
| Immigrants | Syria | 96.7 /100 | #107 | Exceptional 19.9% |
| Native Hawaiians | 96.6 /100 | #108 | Exceptional 19.9% |
| Colombians | 96.6 /100 | #109 | Exceptional 19.9% |
| Immigrants | Western Asia | 96.5 /100 | #110 | Exceptional 19.9% |
| Carpatho Rusyns | 96.1 /100 | #111 | Exceptional 20.0% |
| Immigrants | Netherlands | 96.0 /100 | #112 | Exceptional 20.0% |
| Immigrants | Zimbabwe | 95.9 /100 | #113 | Exceptional 20.0% |
| Immigrants | Colombia | 95.9 /100 | #114 | Exceptional 20.0% |
| Immigrants | Northern Africa | 95.8 /100 | #115 | Exceptional 20.0% |
| Immigrants | Kazakhstan | 95.7 /100 | #116 | Exceptional 20.0% |
Demographics Similar to Bangladeshis by Single Female Poverty
In terms of single female poverty, the demographic groups most similar to Bangladeshis are Spanish American (24.2%, a difference of 0.020%), U.S. Virgin Islander (24.2%, a difference of 0.070%), Cree (24.1%, a difference of 0.15%), Immigrants from Guatemala (24.1%, a difference of 0.19%), and Indonesian (24.3%, a difference of 0.41%).
| Demographics | Rating | Rank | Single Female Poverty |
| Immigrants | Latin America | 0.0 /100 | #280 | Tragic 23.7% |
| Immigrants | Zaire | 0.0 /100 | #281 | Tragic 23.8% |
| Guatemalans | 0.0 /100 | #282 | Tragic 23.8% |
| German Russians | 0.0 /100 | #283 | Tragic 23.9% |
| Immigrants | Dominica | 0.0 /100 | #284 | Tragic 23.9% |
| Immigrants | Guatemala | 0.0 /100 | #285 | Tragic 24.1% |
| Cree | 0.0 /100 | #286 | Tragic 24.1% |
| Bangladeshis | 0.0 /100 | #287 | Tragic 24.2% |
| Spanish Americans | 0.0 /100 | #288 | Tragic 24.2% |
| U.S. Virgin Islanders | 0.0 /100 | #289 | Tragic 24.2% |
| Indonesians | 0.0 /100 | #290 | Tragic 24.3% |
| Osage | 0.0 /100 | #291 | Tragic 24.4% |
| Alsatians | 0.0 /100 | #292 | Tragic 24.5% |
| Americans | 0.0 /100 | #293 | Tragic 24.5% |
| French American Indians | 0.0 /100 | #294 | Tragic 24.6% |