Ugandan vs Immigrants from Nepal Bachelor's Degree
COMPARE
Ugandan
Immigrants from Nepal
Bachelor's Degree
Bachelor's Degree Comparison
Ugandans
Immigrants from Nepal
40.8%
BACHELOR'S DEGREE
96.3/ 100
METRIC RATING
112th/ 347
METRIC RANK
41.7%
BACHELOR'S DEGREE
98.6/ 100
METRIC RATING
94th/ 347
METRIC RANK
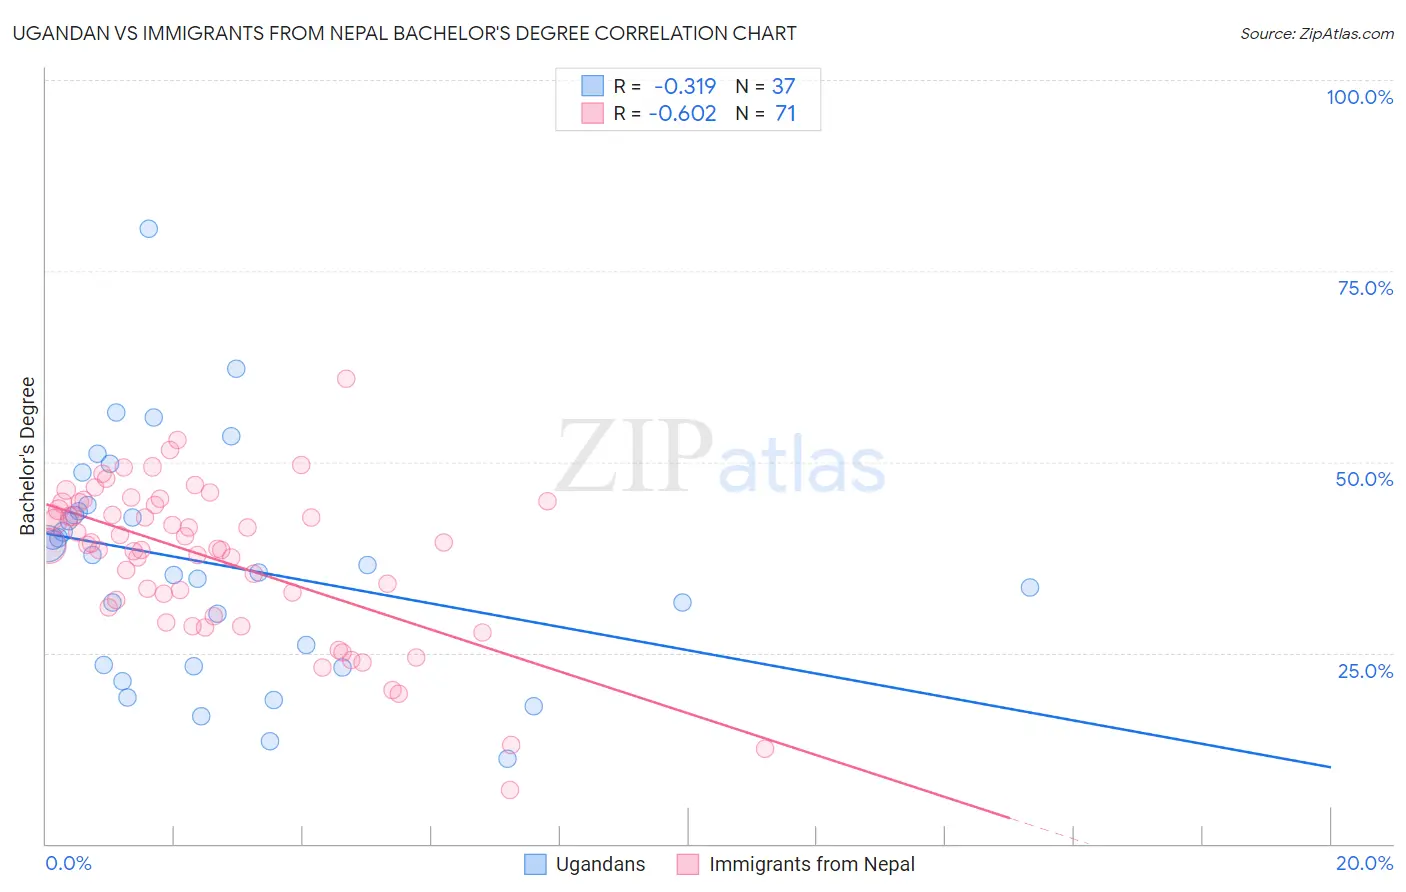
Ugandan vs Immigrants from Nepal Bachelor's Degree Correlation Chart
The statistical analysis conducted on geographies consisting of 94,016,399 people shows a mild negative correlation between the proportion of Ugandans and percentage of population with at least bachelor's degree education in the United States with a correlation coefficient (R) of -0.319 and weighted average of 40.8%. Similarly, the statistical analysis conducted on geographies consisting of 186,767,896 people shows a significant negative correlation between the proportion of Immigrants from Nepal and percentage of population with at least bachelor's degree education in the United States with a correlation coefficient (R) of -0.602 and weighted average of 41.7%, a difference of 2.2%.
Bachelor's Degree Correlation Summary
| Measurement | Ugandan | Immigrants from Nepal |
| Minimum | 11.1% | 7.0% |
| Maximum | 80.5% | 60.9% |
| Range | 69.4% | 53.9% |
| Mean | 36.6% | 37.3% |
| Median | 36.6% | 39.2% |
| Interquartile 25% (IQ1) | 23.3% | 30.9% |
| Interquartile 75% (IQ3) | 43.9% | 44.6% |
| Interquartile Range (IQR) | 20.6% | 13.7% |
| Standard Deviation (Sample) | 14.9% | 10.1% |
| Standard Deviation (Population) | 14.7% | 10.0% |
Demographics Similar to Ugandans and Immigrants from Nepal by Bachelor's Degree
In terms of bachelor's degree, the demographic groups most similar to Ugandans are Brazilian (40.8%, a difference of 0.040%), Immigrants from Chile (40.8%, a difference of 0.050%), Albanian (40.9%, a difference of 0.090%), Arab (40.9%, a difference of 0.17%), and Ukrainian (40.9%, a difference of 0.19%). Similarly, the demographic groups most similar to Immigrants from Nepal are Immigrants from Canada (41.7%, a difference of 0.020%), Immigrants from North America (41.7%, a difference of 0.12%), Immigrants from Moldova (41.6%, a difference of 0.23%), Romanian (41.6%, a difference of 0.29%), and Immigrants from Ukraine (41.5%, a difference of 0.40%).
| Demographics | Rating | Rank | Bachelor's Degree |
| Immigrants | Canada | 98.6 /100 | #93 | Exceptional 41.7% |
| Immigrants | Nepal | 98.6 /100 | #94 | Exceptional 41.7% |
| Immigrants | North America | 98.5 /100 | #95 | Exceptional 41.7% |
| Immigrants | Moldova | 98.4 /100 | #96 | Exceptional 41.6% |
| Romanians | 98.4 /100 | #97 | Exceptional 41.6% |
| Immigrants | Ukraine | 98.3 /100 | #98 | Exceptional 41.5% |
| Immigrants | England | 98.1 /100 | #99 | Exceptional 41.4% |
| Macedonians | 98.1 /100 | #100 | Exceptional 41.4% |
| Immigrants | Morocco | 98.0 /100 | #101 | Exceptional 41.4% |
| Immigrants | Italy | 97.8 /100 | #102 | Exceptional 41.3% |
| Chileans | 97.5 /100 | #103 | Exceptional 41.2% |
| Jordanians | 97.4 /100 | #104 | Exceptional 41.2% |
| Syrians | 97.4 /100 | #105 | Exceptional 41.1% |
| Alsatians | 97.0 /100 | #106 | Exceptional 41.0% |
| Northern Europeans | 96.8 /100 | #107 | Exceptional 41.0% |
| Ukrainians | 96.6 /100 | #108 | Exceptional 40.9% |
| Arabs | 96.6 /100 | #109 | Exceptional 40.9% |
| Albanians | 96.5 /100 | #110 | Exceptional 40.9% |
| Immigrants | Chile | 96.4 /100 | #111 | Exceptional 40.8% |
| Ugandans | 96.3 /100 | #112 | Exceptional 40.8% |
| Brazilians | 96.3 /100 | #113 | Exceptional 40.8% |