Ugandan vs Immigrants from Dominica In Labor Force | Age 16-19
COMPARE
Ugandan
Immigrants from Dominica
In Labor Force | Age 16-19
In Labor Force | Age 16-19 Comparison
Ugandans
Immigrants from Dominica
38.9%
IN LABOR FORCE | AGE 16-19
99.3/ 100
METRIC RATING
98th/ 347
METRIC RANK
32.5%
IN LABOR FORCE | AGE 16-19
0.0/ 100
METRIC RATING
303rd/ 347
METRIC RANK
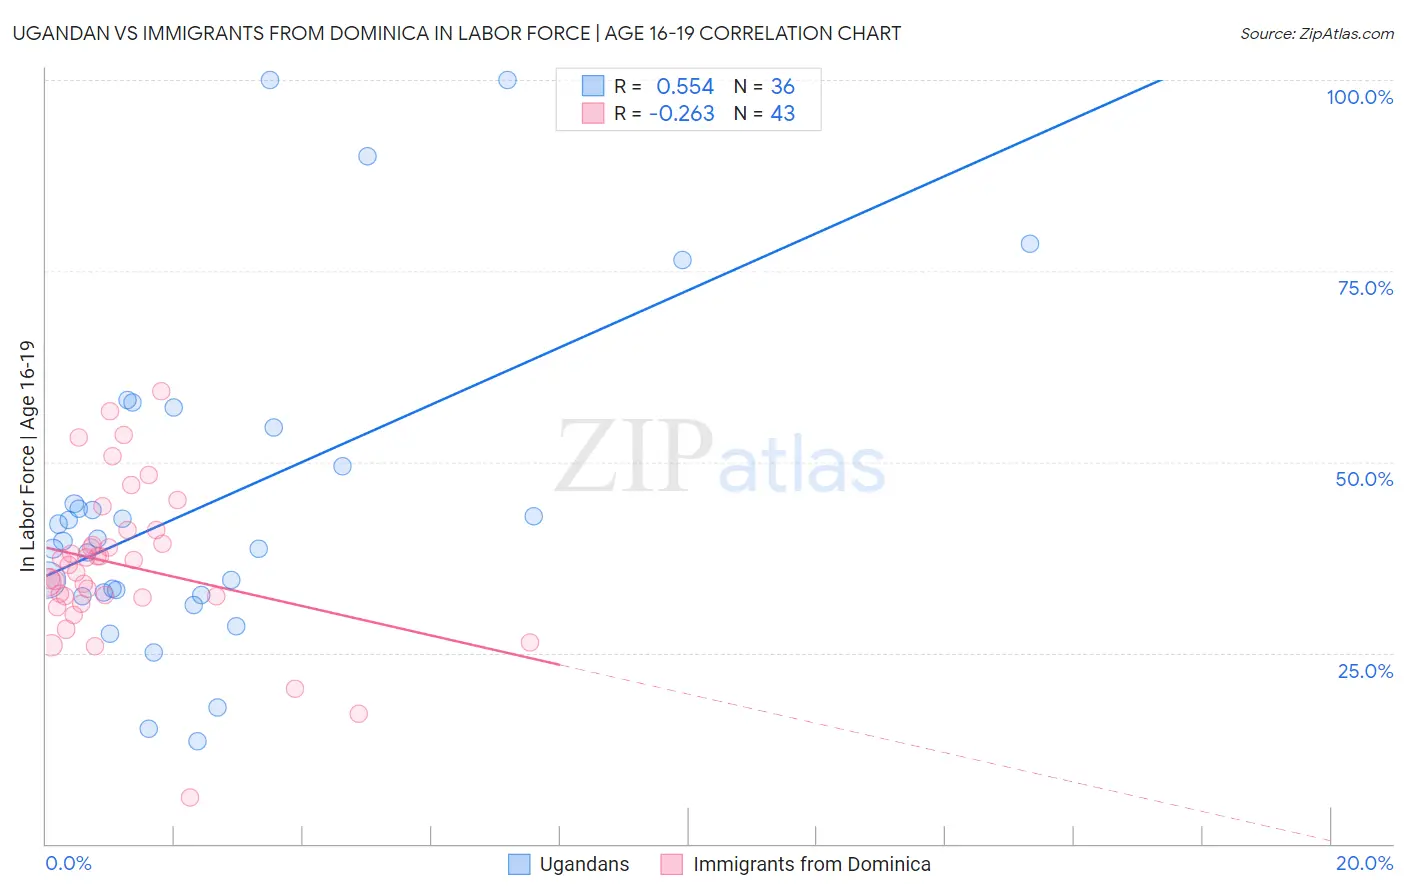
Ugandan vs Immigrants from Dominica In Labor Force | Age 16-19 Correlation Chart
The statistical analysis conducted on geographies consisting of 94,006,992 people shows a substantial positive correlation between the proportion of Ugandans and labor force participation rate among population between the ages 16 and 19 in the United States with a correlation coefficient (R) of 0.554 and weighted average of 38.9%. Similarly, the statistical analysis conducted on geographies consisting of 83,778,469 people shows a weak negative correlation between the proportion of Immigrants from Dominica and labor force participation rate among population between the ages 16 and 19 in the United States with a correlation coefficient (R) of -0.263 and weighted average of 32.5%, a difference of 19.7%.
In Labor Force | Age 16-19 Correlation Summary
| Measurement | Ugandan | Immigrants from Dominica |
| Minimum | 13.5% | 6.0% |
| Maximum | 100.0% | 59.2% |
| Range | 86.5% | 53.2% |
| Mean | 44.8% | 36.5% |
| Median | 39.8% | 36.5% |
| Interquartile 25% (IQ1) | 32.7% | 32.3% |
| Interquartile 75% (IQ3) | 52.0% | 41.0% |
| Interquartile Range (IQR) | 19.3% | 8.7% |
| Standard Deviation (Sample) | 21.2% | 10.1% |
| Standard Deviation (Population) | 20.9% | 10.0% |
Similar Demographics by In Labor Force | Age 16-19
Demographics Similar to Ugandans by In Labor Force | Age 16-19
In terms of in labor force | age 16-19, the demographic groups most similar to Ugandans are Greek (38.9%, a difference of 0.010%), Immigrants from North Macedonia (38.9%, a difference of 0.020%), Latvian (38.9%, a difference of 0.050%), Immigrants from North America (38.9%, a difference of 0.080%), and Blackfeet (38.9%, a difference of 0.17%).
| Demographics | Rating | Rank | In Labor Force | Age 16-19 |
| Spanish Americans | 99.5 /100 | #91 | Exceptional 39.0% |
| Osage | 99.4 /100 | #92 | Exceptional 39.0% |
| Blackfeet | 99.4 /100 | #93 | Exceptional 38.9% |
| Immigrants | Canada | 99.4 /100 | #94 | Exceptional 38.9% |
| Immigrants | North America | 99.4 /100 | #95 | Exceptional 38.9% |
| Latvians | 99.4 /100 | #96 | Exceptional 38.9% |
| Greeks | 99.3 /100 | #97 | Exceptional 38.9% |
| Ugandans | 99.3 /100 | #98 | Exceptional 38.9% |
| Immigrants | North Macedonia | 99.3 /100 | #99 | Exceptional 38.9% |
| Immigrants | Thailand | 99.1 /100 | #100 | Exceptional 38.7% |
| Hmong | 99.1 /100 | #101 | Exceptional 38.7% |
| Zimbabweans | 99.1 /100 | #102 | Exceptional 38.7% |
| Immigrants | Cameroon | 99.0 /100 | #103 | Exceptional 38.7% |
| Immigrants | Eritrea | 99.0 /100 | #104 | Exceptional 38.7% |
| Iraqis | 98.9 /100 | #105 | Exceptional 38.6% |
Demographics Similar to Immigrants from Dominica by In Labor Force | Age 16-19
In terms of in labor force | age 16-19, the demographic groups most similar to Immigrants from Dominica are Israeli (32.4%, a difference of 0.19%), Nicaraguan (32.4%, a difference of 0.24%), Spanish American Indian (32.4%, a difference of 0.37%), Immigrants from Jamaica (32.2%, a difference of 0.86%), and Belizean (32.8%, a difference of 0.90%).
| Demographics | Rating | Rank | In Labor Force | Age 16-19 |
| Jamaicans | 0.1 /100 | #296 | Tragic 33.2% |
| Immigrants | Haiti | 0.1 /100 | #297 | Tragic 33.2% |
| Iranians | 0.0 /100 | #298 | Tragic 33.0% |
| Armenians | 0.0 /100 | #299 | Tragic 32.9% |
| Immigrants | Argentina | 0.0 /100 | #300 | Tragic 32.9% |
| Okinawans | 0.0 /100 | #301 | Tragic 32.8% |
| Belizeans | 0.0 /100 | #302 | Tragic 32.8% |
| Immigrants | Dominica | 0.0 /100 | #303 | Tragic 32.5% |
| Israelis | 0.0 /100 | #304 | Tragic 32.4% |
| Nicaraguans | 0.0 /100 | #305 | Tragic 32.4% |
| Spanish American Indians | 0.0 /100 | #306 | Tragic 32.4% |
| Immigrants | Jamaica | 0.0 /100 | #307 | Tragic 32.2% |
| Navajo | 0.0 /100 | #308 | Tragic 32.1% |
| Immigrants | Eastern Asia | 0.0 /100 | #309 | Tragic 32.0% |
| Immigrants | Iran | 0.0 /100 | #310 | Tragic 32.0% |