Turkish vs Chinese Single Mother Poverty

COMPARE

Turkish
Race
Ancestry
AfghanAfricanAlaska NativeAlaskan AthabascanAlbanianAleutAlsatianAmericanApacheArabArapahoArgentineanArmenianAssyrian/Chaldean/SyriacAustralianAustrianBahamianBangladeshiBarbadianBasqueBelgianBelizeanBermudanBhutaneseBlackfeetBolivianBrazilianBritishBritish West IndianBulgarianBurmeseCajunCambodianCanadianCape VerdeanCarpatho RusynCelticCentral AmericanCentral American IndianCherokeeCheyenneChickasawChileanChippewaChoctawColombianColvilleComancheCosta RicanCreeCreekCroatianCrowCubanCypriotCzechCzechoslovakianDanishDelawareDominicanDutchDutch West IndianEastern EuropeanEcuadorianEgyptianEnglishEstonianEthiopianEuropeanFijianFilipinoFinnishFrenchFrench American IndianFrench CanadianGermanGerman RussianGhanaianGreekGuamanian/ChamorroGuatemalanGuyaneseHaitianHmongHonduranHopiHoumaHungarianIcelanderIndian (Asian)IndonesianInupiatIranianIraqiIrishIroquoisIsraeliItalianJamaicanJapaneseJordanianKenyanKiowaKoreanLaotianLatvianLebaneseLiberianLithuanianLumbeeLuxembourgerMacedonianMalaysianMalteseMarshalleseMenomineeMexicanMexican American IndianMongolianMoroccanNative HawaiianNavajoNepaleseNew ZealanderNicaraguanNigerianNorthern EuropeanNorwegianOkinawanOsageOttawaPaiutePakistaniPalestinianPanamanianParaguayanPennsylvania GermanPeruvianPimaPolishPortuguesePotawatomiPuebloPuerto RicanPuget Sound SalishRomanianRussianSalvadoranSamoanScandinavianScotch-IrishScottishSeminoleSenegaleseSerbianShoshoneSierra LeoneanSiouxSlavicSlovakSloveneSomaliSouth AfricanSouth AmericanSouth American IndianSoviet UnionSpaniardSpanishSpanish AmericanSpanish American IndianSri LankanSubsaharan AfricanSudaneseSwedishSwissSyrianTaiwaneseThaiTlingit-HaidaTohono O'OdhamTonganTrinidadian and TobagonianTsimshianTurkishU.S. Virgin IslanderUgandanUkrainianUruguayanUteVenezuelanVietnameseWelshWest IndianYakamaYaquiYugoslavianYumanYup'ikZimbabwean
Immigration
NonimmigrantsImmigrantsAfghanistanAfricaAlbaniaArgentinaArmeniaAsiaAustraliaAustriaBahamasBangladeshBarbadosBelarusBelgiumBelizeBoliviaBosnia and HerzegovinaBrazilBulgariaBurma/MyanmarCabo VerdeCambodiaCameroonCanadaCaribbeanCentral AmericaChileChinaColombiaCongoCosta RicaCroatiaCubaCzechoslovakiaDenmarkDominicaDominican RepublicEastern AfricaEastern AsiaEastern EuropeEcuadorEgyptEl SalvadorEnglandEritreaEthiopiaEuropeFijiFranceGermanyGhanaGreeceGrenadaGuatemalaGuyanaHaitiHondurasHong KongHungaryIndiaIndonesiaIranIraqIrelandIsraelItalyJamaicaJapanJordanKazakhstanKenyaKoreaKuwaitLaosLatin AmericaLatviaLebanonLiberiaLithuaniaMalaysiaMexicoMicronesiaMiddle AfricaMoldovaMoroccoNepalNetherlandsNicaraguaNigeriaNorth AmericaNorth MacedoniaNorthern AfricaNorthern EuropeNorwayOceaniaPakistanPanamaPeruPhilippinesPolandPortugalRomaniaRussiaSaudi ArabiaScotlandSenegalSerbiaSierra LeoneSingaporeSomaliaSouth AfricaSouth AmericaSouth Central AsiaSouth Eastern AsiaSouthern EuropeSpainSri LankaSt. Vincent and the GrenadinesSudanSwedenSwitzerlandSyriaTaiwanThailandTrinidad and TobagoTurkeyUgandaUkraineUruguayUzbekistanVenezuelaVietnamWest IndiesWestern AfricaWestern AsiaWestern EuropeYemenZaireZimbabweAzores
Chinese
Race
Ancestry
AfghanAfricanAlaska NativeAlaskan AthabascanAlbanianAleutAlsatianAmericanApacheArabArapahoArgentineanArmenianAssyrian/Chaldean/SyriacAustralianAustrianBahamianBangladeshiBarbadianBasqueBelgianBelizeanBermudanBhutaneseBlackfeetBolivianBrazilianBritishBritish West IndianBulgarianBurmeseCajunCambodianCanadianCape VerdeanCarpatho RusynCelticCentral AmericanCentral American IndianCherokeeCheyenneChickasawChileanChineseChippewaChoctawColombianColvilleComancheCosta RicanCreeCreekCroatianCrowCubanCypriotCzechCzechoslovakianDanishDelawareDominicanDutchDutch West IndianEastern EuropeanEcuadorianEgyptianEnglishEstonianEthiopianEuropeanFijianFilipinoFinnishFrenchFrench American IndianFrench CanadianGermanGerman RussianGhanaianGreekGuamanian/ChamorroGuatemalanGuyaneseHaitianHmongHonduranHopiHoumaHungarianIcelanderIndian (Asian)IndonesianInupiatIranianIraqiIrishIroquoisIsraeliItalianJamaicanJapaneseJordanianKenyanKiowaKoreanLaotianLatvianLebaneseLiberianLithuanianLumbeeLuxembourgerMacedonianMalaysianMalteseMarshalleseMenomineeMexicanMexican American IndianMongolianMoroccanNative HawaiianNavajoNepaleseNew ZealanderNicaraguanNigerianNorthern EuropeanNorwegianOkinawanOsageOttawaPaiutePakistaniPalestinianPanamanianParaguayanPennsylvania GermanPeruvianPimaPolishPortuguesePotawatomiPuebloPuerto RicanPuget Sound SalishRomanianRussianSalvadoranSamoanScandinavianScotch-IrishScottishSeminoleSenegaleseSerbianShoshoneSierra LeoneanSiouxSlavicSlovakSloveneSomaliSouth AfricanSouth AmericanSouth American IndianSoviet UnionSpaniardSpanishSpanish AmericanSpanish American IndianSri LankanSubsaharan AfricanSudaneseSwedishSwissSyrianTaiwaneseThaiTlingit-HaidaTohono O'OdhamTonganTrinidadian and TobagonianTsimshianU.S. Virgin IslanderUgandanUkrainianUruguayanUteVenezuelanVietnameseWelshWest IndianYakamaYaquiYugoslavianYumanYup'ikZimbabwean
Immigration
NonimmigrantsImmigrantsAfghanistanAfricaAlbaniaArgentinaArmeniaAsiaAustraliaAustriaBahamasBangladeshBarbadosBelarusBelgiumBelizeBoliviaBosnia and HerzegovinaBrazilBulgariaBurma/MyanmarCabo VerdeCambodiaCameroonCanadaCaribbeanCentral AmericaChileChinaColombiaCongoCosta RicaCroatiaCubaCzechoslovakiaDenmarkDominicaDominican RepublicEastern AfricaEastern AsiaEastern EuropeEcuadorEgyptEl SalvadorEnglandEritreaEthiopiaEuropeFijiFranceGermanyGhanaGreeceGrenadaGuatemalaGuyanaHaitiHondurasHong KongHungaryIndiaIndonesiaIranIraqIrelandIsraelItalyJamaicaJapanJordanKazakhstanKenyaKoreaKuwaitLaosLatin AmericaLatviaLebanonLiberiaLithuaniaMalaysiaMexicoMicronesiaMiddle AfricaMoldovaMoroccoNepalNetherlandsNicaraguaNigeriaNorth AmericaNorth MacedoniaNorthern AfricaNorthern EuropeNorwayOceaniaPakistanPanamaPeruPhilippinesPolandPortugalRomaniaRussiaSaudi ArabiaScotlandSenegalSerbiaSierra LeoneSingaporeSomaliaSouth AfricaSouth AmericaSouth Central AsiaSouth Eastern AsiaSouthern EuropeSpainSri LankaSt. Vincent and the GrenadinesSudanSwedenSwitzerlandSyriaTaiwanThailandTrinidad and TobagoTurkeyUgandaUkraineUruguayUzbekistanVenezuelaVietnamWest IndiesWestern AfricaWestern AsiaWestern EuropeYemenZaireZimbabweAzores
Single Mother Poverty
Income
Poverty
Unemployment
Labor Participation
Family Structure
Vehicle Availability
Education Level
Disability

Single Mother Poverty Comparison

Turks

Chinese

Exceptional
Exceptional
26.4%
SINGLE MOTHER POVERTY
100.0/ 100
METRIC RATING
30th/ 347
METRIC RANK
24.6%
SINGLE MOTHER POVERTY
100.0/ 100
METRIC RATING
7th/ 347
METRIC RANK

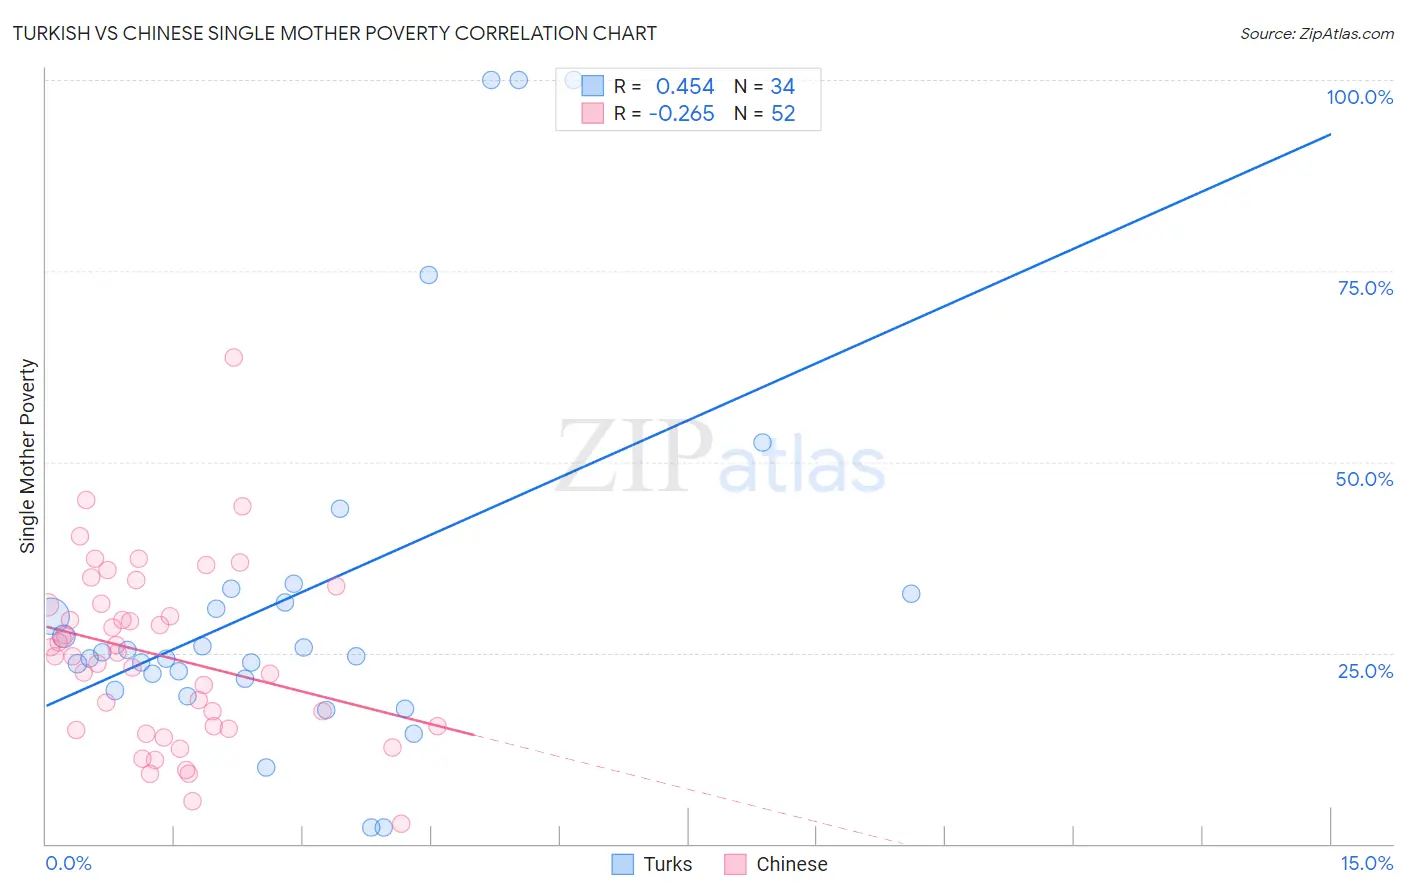
Turkish vs Chinese Single Mother Poverty Correlation Chart

The statistical analysis conducted on geographies consisting of 265,895,030 people shows a moderate positive correlation between the proportion of Turks and poverty level among single mothers in the United States with a correlation coefficient (R) of 0.454 and weighted average of 26.4%. Similarly, the statistical analysis conducted on geographies consisting of 64,411,570 people shows a weak negative correlation between the proportion of Chinese and poverty level among single mothers in the United States with a correlation coefficient (R) of -0.265 and weighted average of 24.6%, a difference of 7.4%.
Turkish vs Chinese Single Mother Poverty

Single Mother Poverty Correlation Summary

MeasurementTurkishChinese
Minimum2.2%2.6%
Maximum100.0%63.6%
Range97.8%61.1%
Mean32.5%24.6%
Median24.8%24.8%
Interquartile 25% (IQ1)21.6%15.2%
Interquartile 75% (IQ3)32.8%31.4%
Interquartile Range (IQR)11.2%16.2%
Standard Deviation (Sample)24.9%11.6%
Standard Deviation (Population)24.5%11.4%

Similar Demographics by Single Mother Poverty

Demographics Similar to Turks by Single Mother Poverty

In terms of single mother poverty, the demographic groups most similar to Turks are Jordanian (26.4%, a difference of 0.090%), Korean (26.4%, a difference of 0.14%), Immigrants from Japan (26.4%, a difference of 0.15%), Immigrants from Philippines (26.5%, a difference of 0.16%), and Immigrants from Sri Lanka (26.3%, a difference of 0.38%).
DemographicsRating | RankSingle Mother Poverty
Burmese
100.0
/100
|
#23
Exceptional
26.2%
Immigrants | Moldova
100.0
/100
|
#24
Exceptional
26.2%
Immigrants | Asia
100.0
/100
|
#25
Exceptional
26.3%
Immigrants | Sri Lanka
100.0
/100
|
#26
Exceptional
26.3%
Immigrants | Japan
100.0
/100
|
#27
Exceptional
26.4%
Koreans
100.0
/100
|
#28
Exceptional
26.4%
Jordanians
100.0
/100
|
#29
Exceptional
26.4%
Turks
100.0
/100
|
#30
Exceptional
26.4%
Immigrants | Philippines
100.0
/100
|
#31
Exceptional
26.5%
Tongans
99.9
/100
|
#32
Exceptional
26.5%
Bulgarians
99.9
/100
|
#33
Exceptional
26.5%
Immigrants | Indonesia
99.9
/100
|
#34
Exceptional
26.6%
Maltese
99.9
/100
|
#35
Exceptional
26.6%
Okinawans
99.9
/100
|
#36
Exceptional
26.6%
Immigrants | Israel
99.9
/100
|
#37
Exceptional
26.6%

Demographics Similar to Chinese by Single Mother Poverty

In terms of single mother poverty, the demographic groups most similar to Chinese are Thai (24.5%, a difference of 0.54%), Immigrants from Hong Kong (24.4%, a difference of 1.0%), Filipino (24.3%, a difference of 1.3%), Immigrants from Iran (25.1%, a difference of 2.0%), and Immigrants from Lithuania (25.2%, a difference of 2.4%).
DemographicsRating | RankSingle Mother Poverty
Assyrians/Chaldeans/Syriacs
100.0
/100
|
#1
Exceptional
23.8%
Immigrants | India
100.0
/100
|
#2
Exceptional
23.8%
Immigrants | Taiwan
100.0
/100
|
#3
Exceptional
23.9%
Filipinos
100.0
/100
|
#4
Exceptional
24.3%
Immigrants | Hong Kong
100.0
/100
|
#5
Exceptional
24.4%
Thais
100.0
/100
|
#6
Exceptional
24.5%
Chinese
100.0
/100
|
#7
Exceptional
24.6%
Immigrants | Iran
100.0
/100
|
#8
Exceptional
25.1%
Immigrants | Lithuania
100.0
/100
|
#9
Exceptional
25.2%
Immigrants | South Central Asia
100.0
/100
|
#10
Exceptional
25.3%
Iranians
100.0
/100
|
#11
Exceptional
25.5%
Bhutanese
100.0
/100
|
#12
Exceptional
25.6%
Indians (Asian)
100.0
/100
|
#13
Exceptional
25.8%
Immigrants | Singapore
100.0
/100
|
#14
Exceptional
25.8%
Immigrants | Ireland
100.0
/100
|
#15
Exceptional
25.8%