Nicaraguan vs Immigrants from Dominican Republic Single Mother Poverty
COMPARE
Nicaraguan
Immigrants from Dominican Republic
Single Mother Poverty
Single Mother Poverty Comparison
Nicaraguans
Immigrants from Dominican Republic
29.8%
SINGLE MOTHER POVERTY
12.4/ 100
METRIC RATING
212th/ 347
METRIC RANK
34.4%
SINGLE MOTHER POVERTY
0.0/ 100
METRIC RATING
313th/ 347
METRIC RANK
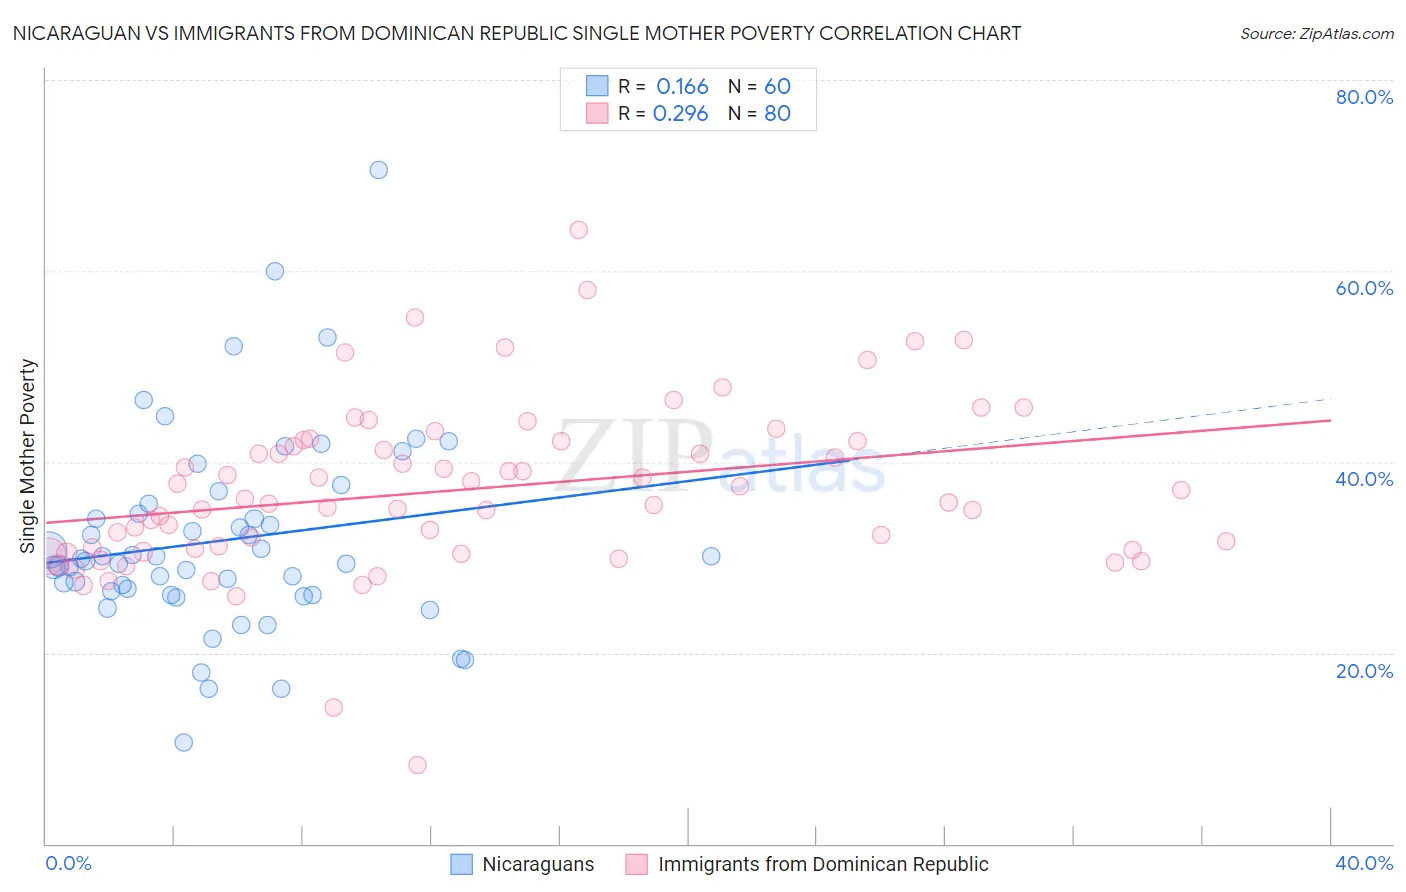
Nicaraguan vs Immigrants from Dominican Republic Single Mother Poverty Correlation Chart
The statistical analysis conducted on geographies consisting of 282,208,103 people shows a poor positive correlation between the proportion of Nicaraguans and poverty level among single mothers in the United States with a correlation coefficient (R) of 0.166 and weighted average of 29.8%. Similarly, the statistical analysis conducted on geographies consisting of 269,699,812 people shows a weak positive correlation between the proportion of Immigrants from Dominican Republic and poverty level among single mothers in the United States with a correlation coefficient (R) of 0.296 and weighted average of 34.4%, a difference of 15.1%.
Single Mother Poverty Correlation Summary
| Measurement | Nicaraguan | Immigrants from Dominican Republic |
| Minimum | 10.6% | 8.3% |
| Maximum | 70.6% | 64.2% |
| Range | 60.0% | 56.0% |
| Mean | 31.8% | 37.1% |
| Median | 29.7% | 36.0% |
| Interquartile 25% (IQ1) | 26.3% | 30.8% |
| Interquartile 75% (IQ3) | 35.1% | 42.1% |
| Interquartile Range (IQR) | 8.8% | 11.3% |
| Standard Deviation (Sample) | 10.4% | 8.9% |
| Standard Deviation (Population) | 10.3% | 8.9% |
Similar Demographics by Single Mother Poverty
Demographics Similar to Nicaraguans by Single Mother Poverty
In terms of single mother poverty, the demographic groups most similar to Nicaraguans are Guyanese (29.8%, a difference of 0.040%), Immigrants from Thailand (29.9%, a difference of 0.050%), Liberian (29.9%, a difference of 0.080%), Jamaican (29.9%, a difference of 0.080%), and Haitian (29.8%, a difference of 0.090%).
| Demographics | Rating | Rank | Single Mother Poverty |
| Czechoslovakians | 16.1 /100 | #205 | Poor 29.7% |
| Immigrants | Haiti | 15.8 /100 | #206 | Poor 29.7% |
| Immigrants | Panama | 15.5 /100 | #207 | Poor 29.8% |
| Immigrants | Guyana | 14.7 /100 | #208 | Poor 29.8% |
| Irish | 13.9 /100 | #209 | Poor 29.8% |
| Haitians | 13.3 /100 | #210 | Poor 29.8% |
| Guyanese | 12.8 /100 | #211 | Poor 29.8% |
| Nicaraguans | 12.4 /100 | #212 | Poor 29.8% |
| Immigrants | Thailand | 12.0 /100 | #213 | Poor 29.9% |
| Liberians | 11.7 /100 | #214 | Poor 29.9% |
| Jamaicans | 11.7 /100 | #215 | Poor 29.9% |
| Immigrants | Western Africa | 11.5 /100 | #216 | Poor 29.9% |
| Immigrants | Ghana | 11.3 /100 | #217 | Poor 29.9% |
| Hungarians | 10.3 /100 | #218 | Poor 29.9% |
| Finns | 9.3 /100 | #219 | Tragic 30.0% |
Demographics Similar to Immigrants from Dominican Republic by Single Mother Poverty
In terms of single mother poverty, the demographic groups most similar to Immigrants from Dominican Republic are Central American Indian (34.3%, a difference of 0.080%), Alsatian (34.3%, a difference of 0.16%), Chickasaw (34.4%, a difference of 0.17%), Hopi (34.5%, a difference of 0.25%), and Dominican (34.5%, a difference of 0.37%).
| Demographics | Rating | Rank | Single Mother Poverty |
| Immigrants | Congo | 0.0 /100 | #306 | Tragic 33.8% |
| Comanche | 0.0 /100 | #307 | Tragic 33.9% |
| Immigrants | Mexico | 0.0 /100 | #308 | Tragic 34.0% |
| Potawatomi | 0.0 /100 | #309 | Tragic 34.1% |
| Hondurans | 0.0 /100 | #310 | Tragic 34.2% |
| Alsatians | 0.0 /100 | #311 | Tragic 34.3% |
| Central American Indians | 0.0 /100 | #312 | Tragic 34.3% |
| Immigrants | Dominican Republic | 0.0 /100 | #313 | Tragic 34.4% |
| Chickasaw | 0.0 /100 | #314 | Tragic 34.4% |
| Hopi | 0.0 /100 | #315 | Tragic 34.5% |
| Dominicans | 0.0 /100 | #316 | Tragic 34.5% |
| Cherokee | 0.0 /100 | #317 | Tragic 34.5% |
| Immigrants | Honduras | 0.0 /100 | #318 | Tragic 34.7% |
| Chippewa | 0.0 /100 | #319 | Tragic 34.8% |
| Iroquois | 0.0 /100 | #320 | Tragic 34.8% |