Turkish vs Immigrants from Uganda Single Mother Poverty
COMPARE
Turkish
Immigrants from Uganda
Single Mother Poverty
Single Mother Poverty Comparison
Turks
Immigrants from Uganda
26.4%
SINGLE MOTHER POVERTY
100.0/ 100
METRIC RATING
30th/ 347
METRIC RANK
28.3%
SINGLE MOTHER POVERTY
92.5/ 100
METRIC RATING
116th/ 347
METRIC RANK
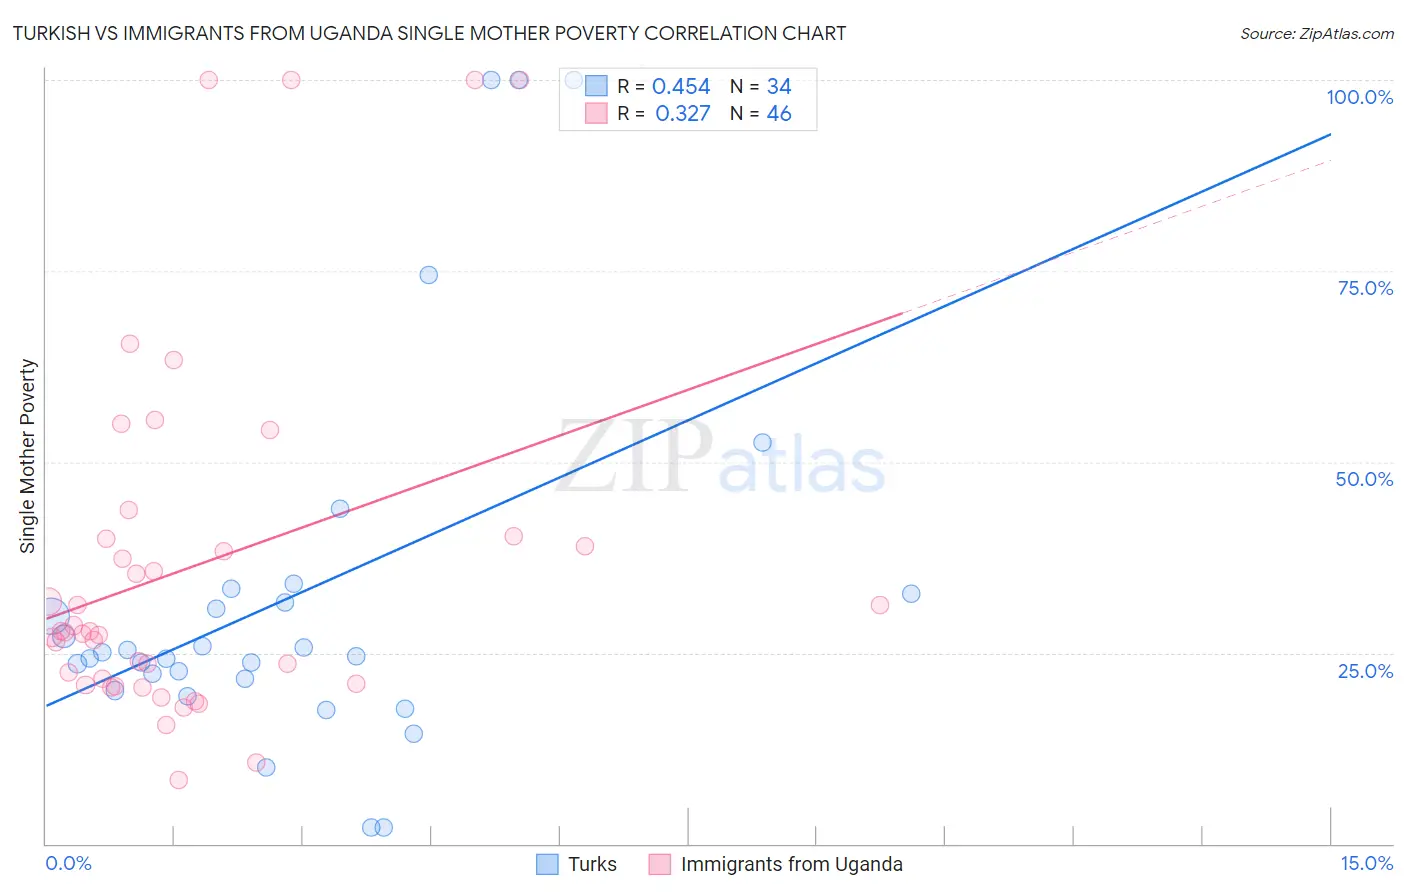
Turkish vs Immigrants from Uganda Single Mother Poverty Correlation Chart
The statistical analysis conducted on geographies consisting of 265,895,030 people shows a moderate positive correlation between the proportion of Turks and poverty level among single mothers in the United States with a correlation coefficient (R) of 0.454 and weighted average of 26.4%. Similarly, the statistical analysis conducted on geographies consisting of 125,043,524 people shows a mild positive correlation between the proportion of Immigrants from Uganda and poverty level among single mothers in the United States with a correlation coefficient (R) of 0.327 and weighted average of 28.3%, a difference of 7.0%.
Single Mother Poverty Correlation Summary
| Measurement | Turkish | Immigrants from Uganda |
| Minimum | 2.2% | 8.4% |
| Maximum | 100.0% | 100.0% |
| Range | 97.8% | 91.6% |
| Mean | 32.5% | 36.3% |
| Median | 24.8% | 27.8% |
| Interquartile 25% (IQ1) | 21.6% | 21.0% |
| Interquartile 75% (IQ3) | 32.8% | 40.0% |
| Interquartile Range (IQR) | 11.2% | 19.0% |
| Standard Deviation (Sample) | 24.9% | 23.6% |
| Standard Deviation (Population) | 24.5% | 23.3% |
Similar Demographics by Single Mother Poverty
Demographics Similar to Turks by Single Mother Poverty
In terms of single mother poverty, the demographic groups most similar to Turks are Jordanian (26.4%, a difference of 0.090%), Korean (26.4%, a difference of 0.14%), Immigrants from Japan (26.4%, a difference of 0.15%), Immigrants from Philippines (26.5%, a difference of 0.16%), and Immigrants from Sri Lanka (26.3%, a difference of 0.38%).
| Demographics | Rating | Rank | Single Mother Poverty |
| Burmese | 100.0 /100 | #23 | Exceptional 26.2% |
| Immigrants | Moldova | 100.0 /100 | #24 | Exceptional 26.2% |
| Immigrants | Asia | 100.0 /100 | #25 | Exceptional 26.3% |
| Immigrants | Sri Lanka | 100.0 /100 | #26 | Exceptional 26.3% |
| Immigrants | Japan | 100.0 /100 | #27 | Exceptional 26.4% |
| Koreans | 100.0 /100 | #28 | Exceptional 26.4% |
| Jordanians | 100.0 /100 | #29 | Exceptional 26.4% |
| Turks | 100.0 /100 | #30 | Exceptional 26.4% |
| Immigrants | Philippines | 100.0 /100 | #31 | Exceptional 26.5% |
| Tongans | 99.9 /100 | #32 | Exceptional 26.5% |
| Bulgarians | 99.9 /100 | #33 | Exceptional 26.5% |
| Immigrants | Indonesia | 99.9 /100 | #34 | Exceptional 26.6% |
| Maltese | 99.9 /100 | #35 | Exceptional 26.6% |
| Okinawans | 99.9 /100 | #36 | Exceptional 26.6% |
| Immigrants | Israel | 99.9 /100 | #37 | Exceptional 26.6% |
Demographics Similar to Immigrants from Uganda by Single Mother Poverty
In terms of single mother poverty, the demographic groups most similar to Immigrants from Uganda are Australian (28.3%, a difference of 0.010%), Immigrants from Kuwait (28.3%, a difference of 0.020%), Brazilian (28.3%, a difference of 0.020%), Immigrants from Western Asia (28.3%, a difference of 0.030%), and Immigrants from Syria (28.3%, a difference of 0.030%).
| Demographics | Rating | Rank | Single Mother Poverty |
| Immigrants | Armenia | 95.2 /100 | #109 | Exceptional 28.1% |
| Croatians | 94.8 /100 | #110 | Exceptional 28.2% |
| Venezuelans | 94.5 /100 | #111 | Exceptional 28.2% |
| Immigrants | Kazakhstan | 94.5 /100 | #112 | Exceptional 28.2% |
| Immigrants | South Africa | 93.2 /100 | #113 | Exceptional 28.3% |
| Immigrants | Western Asia | 92.7 /100 | #114 | Exceptional 28.3% |
| Immigrants | Kuwait | 92.7 /100 | #115 | Exceptional 28.3% |
| Immigrants | Uganda | 92.5 /100 | #116 | Exceptional 28.3% |
| Australians | 92.5 /100 | #117 | Exceptional 28.3% |
| Brazilians | 92.4 /100 | #118 | Exceptional 28.3% |
| Immigrants | Syria | 92.4 /100 | #119 | Exceptional 28.3% |
| Cypriots | 92.3 /100 | #120 | Exceptional 28.3% |
| Immigrants | Afghanistan | 92.1 /100 | #121 | Exceptional 28.3% |
| Colombians | 91.8 /100 | #122 | Exceptional 28.3% |
| Uruguayans | 91.7 /100 | #123 | Exceptional 28.3% |