Turkish vs Immigrants from Romania Single Mother Poverty
COMPARE
Turkish
Immigrants from Romania
Single Mother Poverty
Single Mother Poverty Comparison
Turks
Immigrants from Romania
26.4%
SINGLE MOTHER POVERTY
100.0/ 100
METRIC RATING
30th/ 347
METRIC RANK
27.2%
SINGLE MOTHER POVERTY
99.7/ 100
METRIC RATING
56th/ 347
METRIC RANK
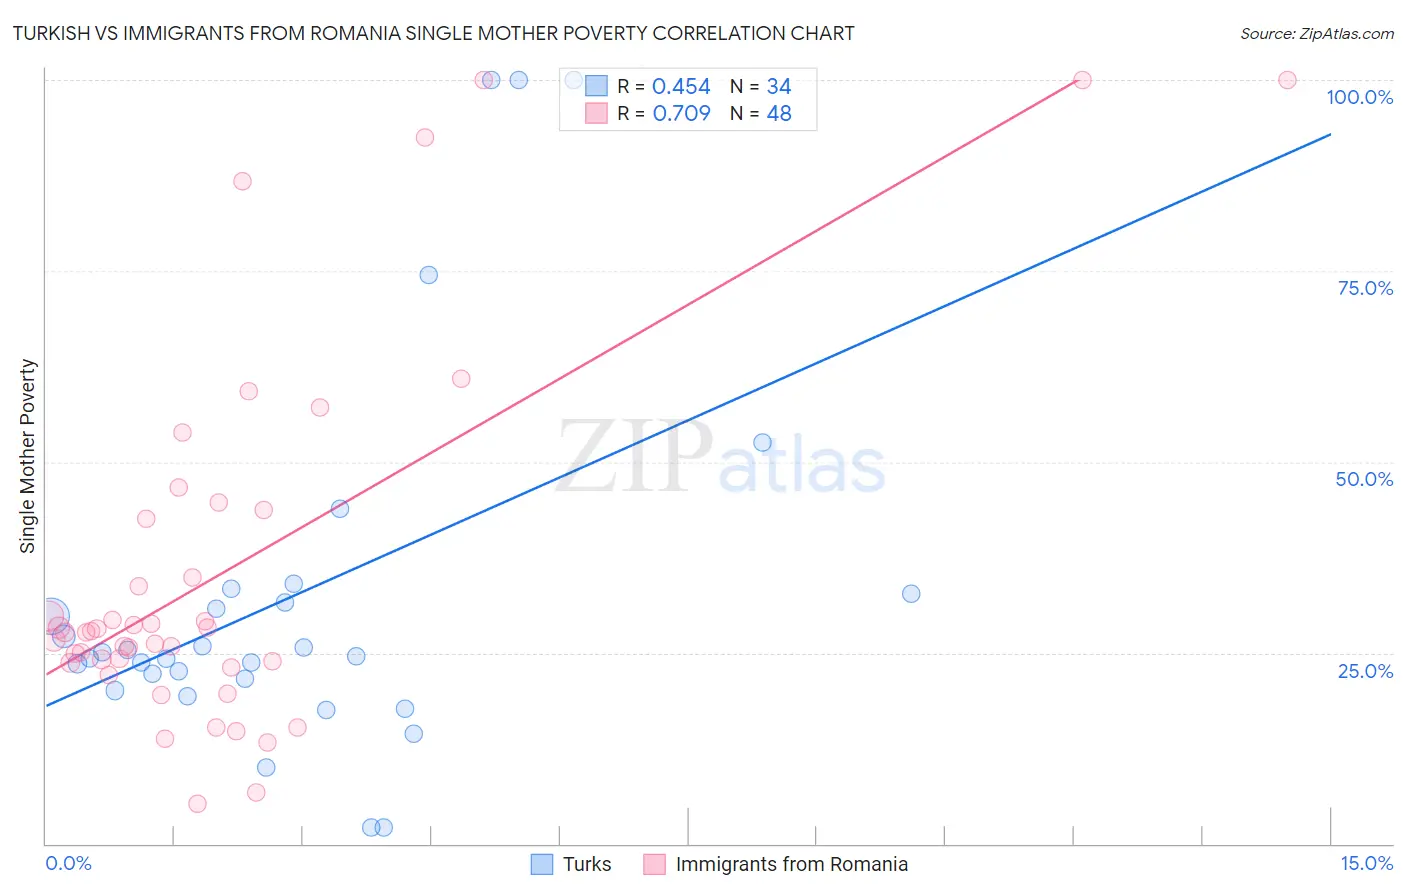
Turkish vs Immigrants from Romania Single Mother Poverty Correlation Chart
The statistical analysis conducted on geographies consisting of 265,895,030 people shows a moderate positive correlation between the proportion of Turks and poverty level among single mothers in the United States with a correlation coefficient (R) of 0.454 and weighted average of 26.4%. Similarly, the statistical analysis conducted on geographies consisting of 252,141,332 people shows a strong positive correlation between the proportion of Immigrants from Romania and poverty level among single mothers in the United States with a correlation coefficient (R) of 0.709 and weighted average of 27.2%, a difference of 2.7%.
Single Mother Poverty Correlation Summary
| Measurement | Turkish | Immigrants from Romania |
| Minimum | 2.2% | 5.2% |
| Maximum | 100.0% | 100.0% |
| Range | 97.8% | 94.8% |
| Mean | 32.5% | 35.7% |
| Median | 24.8% | 27.8% |
| Interquartile 25% (IQ1) | 21.6% | 23.8% |
| Interquartile 75% (IQ3) | 32.8% | 43.1% |
| Interquartile Range (IQR) | 11.2% | 19.3% |
| Standard Deviation (Sample) | 24.9% | 24.1% |
| Standard Deviation (Population) | 24.5% | 23.8% |
Similar Demographics by Single Mother Poverty
Demographics Similar to Turks by Single Mother Poverty
In terms of single mother poverty, the demographic groups most similar to Turks are Jordanian (26.4%, a difference of 0.090%), Korean (26.4%, a difference of 0.14%), Immigrants from Japan (26.4%, a difference of 0.15%), Immigrants from Philippines (26.5%, a difference of 0.16%), and Immigrants from Sri Lanka (26.3%, a difference of 0.38%).
| Demographics | Rating | Rank | Single Mother Poverty |
| Burmese | 100.0 /100 | #23 | Exceptional 26.2% |
| Immigrants | Moldova | 100.0 /100 | #24 | Exceptional 26.2% |
| Immigrants | Asia | 100.0 /100 | #25 | Exceptional 26.3% |
| Immigrants | Sri Lanka | 100.0 /100 | #26 | Exceptional 26.3% |
| Immigrants | Japan | 100.0 /100 | #27 | Exceptional 26.4% |
| Koreans | 100.0 /100 | #28 | Exceptional 26.4% |
| Jordanians | 100.0 /100 | #29 | Exceptional 26.4% |
| Turks | 100.0 /100 | #30 | Exceptional 26.4% |
| Immigrants | Philippines | 100.0 /100 | #31 | Exceptional 26.5% |
| Tongans | 99.9 /100 | #32 | Exceptional 26.5% |
| Bulgarians | 99.9 /100 | #33 | Exceptional 26.5% |
| Immigrants | Indonesia | 99.9 /100 | #34 | Exceptional 26.6% |
| Maltese | 99.9 /100 | #35 | Exceptional 26.6% |
| Okinawans | 99.9 /100 | #36 | Exceptional 26.6% |
| Immigrants | Israel | 99.9 /100 | #37 | Exceptional 26.6% |
Demographics Similar to Immigrants from Romania by Single Mother Poverty
In terms of single mother poverty, the demographic groups most similar to Immigrants from Romania are Palestinian (27.2%, a difference of 0.030%), Immigrants from Egypt (27.1%, a difference of 0.050%), Immigrants from Bulgaria (27.1%, a difference of 0.080%), Immigrants from Jordan (27.1%, a difference of 0.11%), and Immigrants from South Eastern Asia (27.1%, a difference of 0.15%).
| Demographics | Rating | Rank | Single Mother Poverty |
| Cambodians | 99.8 /100 | #49 | Exceptional 27.0% |
| Laotians | 99.8 /100 | #50 | Exceptional 27.0% |
| Immigrants | Argentina | 99.7 /100 | #51 | Exceptional 27.1% |
| Immigrants | South Eastern Asia | 99.7 /100 | #52 | Exceptional 27.1% |
| Immigrants | Jordan | 99.7 /100 | #53 | Exceptional 27.1% |
| Immigrants | Bulgaria | 99.7 /100 | #54 | Exceptional 27.1% |
| Immigrants | Egypt | 99.7 /100 | #55 | Exceptional 27.1% |
| Immigrants | Romania | 99.7 /100 | #56 | Exceptional 27.2% |
| Palestinians | 99.7 /100 | #57 | Exceptional 27.2% |
| Argentineans | 99.6 /100 | #58 | Exceptional 27.2% |
| Paraguayans | 99.6 /100 | #59 | Exceptional 27.2% |
| Eastern Europeans | 99.6 /100 | #60 | Exceptional 27.2% |
| Immigrants | Eastern Europe | 99.6 /100 | #61 | Exceptional 27.2% |
| Immigrants | Malaysia | 99.5 /100 | #62 | Exceptional 27.3% |
| Immigrants | Northern Europe | 99.5 /100 | #63 | Exceptional 27.3% |