Turkish vs Immigrants from Uzbekistan Single Mother Poverty
COMPARE
Turkish
Immigrants from Uzbekistan
Single Mother Poverty
Single Mother Poverty Comparison
Turks
Immigrants from Uzbekistan
26.4%
SINGLE MOTHER POVERTY
100.0/ 100
METRIC RATING
30th/ 347
METRIC RANK
29.3%
SINGLE MOTHER POVERTY
42.6/ 100
METRIC RATING
179th/ 347
METRIC RANK
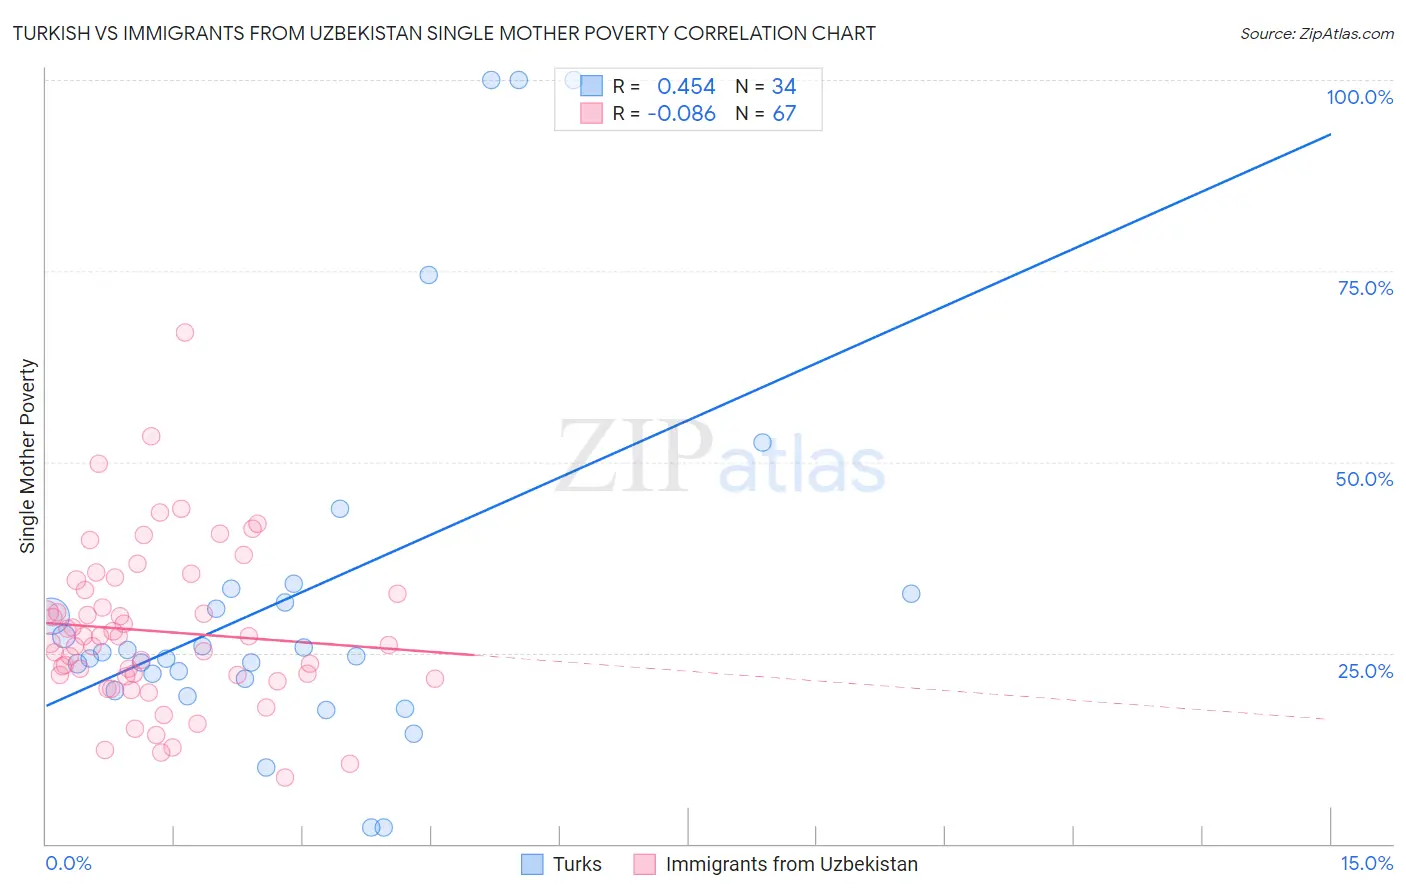
Turkish vs Immigrants from Uzbekistan Single Mother Poverty Correlation Chart
The statistical analysis conducted on geographies consisting of 265,895,030 people shows a moderate positive correlation between the proportion of Turks and poverty level among single mothers in the United States with a correlation coefficient (R) of 0.454 and weighted average of 26.4%. Similarly, the statistical analysis conducted on geographies consisting of 117,476,483 people shows a slight negative correlation between the proportion of Immigrants from Uzbekistan and poverty level among single mothers in the United States with a correlation coefficient (R) of -0.086 and weighted average of 29.3%, a difference of 10.7%.
Single Mother Poverty Correlation Summary
| Measurement | Turkish | Immigrants from Uzbekistan |
| Minimum | 2.2% | 8.7% |
| Maximum | 100.0% | 67.0% |
| Range | 97.8% | 58.3% |
| Mean | 32.5% | 27.8% |
| Median | 24.8% | 26.3% |
| Interquartile 25% (IQ1) | 21.6% | 21.9% |
| Interquartile 75% (IQ3) | 32.8% | 33.2% |
| Interquartile Range (IQR) | 11.2% | 11.3% |
| Standard Deviation (Sample) | 24.9% | 10.5% |
| Standard Deviation (Population) | 24.5% | 10.4% |
Similar Demographics by Single Mother Poverty
Demographics Similar to Turks by Single Mother Poverty
In terms of single mother poverty, the demographic groups most similar to Turks are Jordanian (26.4%, a difference of 0.090%), Korean (26.4%, a difference of 0.14%), Immigrants from Japan (26.4%, a difference of 0.15%), Immigrants from Philippines (26.5%, a difference of 0.16%), and Immigrants from Sri Lanka (26.3%, a difference of 0.38%).
| Demographics | Rating | Rank | Single Mother Poverty |
| Burmese | 100.0 /100 | #23 | Exceptional 26.2% |
| Immigrants | Moldova | 100.0 /100 | #24 | Exceptional 26.2% |
| Immigrants | Asia | 100.0 /100 | #25 | Exceptional 26.3% |
| Immigrants | Sri Lanka | 100.0 /100 | #26 | Exceptional 26.3% |
| Immigrants | Japan | 100.0 /100 | #27 | Exceptional 26.4% |
| Koreans | 100.0 /100 | #28 | Exceptional 26.4% |
| Jordanians | 100.0 /100 | #29 | Exceptional 26.4% |
| Turks | 100.0 /100 | #30 | Exceptional 26.4% |
| Immigrants | Philippines | 100.0 /100 | #31 | Exceptional 26.5% |
| Tongans | 99.9 /100 | #32 | Exceptional 26.5% |
| Bulgarians | 99.9 /100 | #33 | Exceptional 26.5% |
| Immigrants | Indonesia | 99.9 /100 | #34 | Exceptional 26.6% |
| Maltese | 99.9 /100 | #35 | Exceptional 26.6% |
| Okinawans | 99.9 /100 | #36 | Exceptional 26.6% |
| Immigrants | Israel | 99.9 /100 | #37 | Exceptional 26.6% |
Demographics Similar to Immigrants from Uzbekistan by Single Mother Poverty
In terms of single mother poverty, the demographic groups most similar to Immigrants from Uzbekistan are South American Indian (29.3%, a difference of 0.030%), Immigrants from Norway (29.3%, a difference of 0.050%), Canadian (29.3%, a difference of 0.11%), Immigrants from Bosnia and Herzegovina (29.2%, a difference of 0.12%), and Immigrants from Eastern Africa (29.3%, a difference of 0.20%).
| Demographics | Rating | Rank | Single Mother Poverty |
| Carpatho Rusyns | 53.8 /100 | #172 | Average 29.1% |
| British | 50.6 /100 | #173 | Average 29.2% |
| Immigrants | Saudi Arabia | 50.0 /100 | #174 | Average 29.2% |
| Immigrants | Costa Rica | 48.8 /100 | #175 | Average 29.2% |
| Hawaiians | 47.8 /100 | #176 | Average 29.2% |
| Immigrants | Bosnia and Herzegovina | 45.1 /100 | #177 | Average 29.2% |
| South American Indians | 43.2 /100 | #178 | Average 29.3% |
| Immigrants | Uzbekistan | 42.6 /100 | #179 | Average 29.3% |
| Immigrants | Norway | 41.5 /100 | #180 | Average 29.3% |
| Canadians | 40.4 /100 | #181 | Average 29.3% |
| Immigrants | Eastern Africa | 38.5 /100 | #182 | Fair 29.3% |
| Nepalese | 38.3 /100 | #183 | Fair 29.3% |
| Nigerians | 38.0 /100 | #184 | Fair 29.3% |
| Ghanaians | 36.8 /100 | #185 | Fair 29.4% |
| Yugoslavians | 36.0 /100 | #186 | Fair 29.4% |