Turkish vs South American Single Mother Poverty
COMPARE
Turkish
South American
Single Mother Poverty
Single Mother Poverty Comparison
Turks
South Americans
26.4%
SINGLE MOTHER POVERTY
100.0/ 100
METRIC RATING
30th/ 347
METRIC RANK
28.4%
SINGLE MOTHER POVERTY
90.4/ 100
METRIC RATING
129th/ 347
METRIC RANK
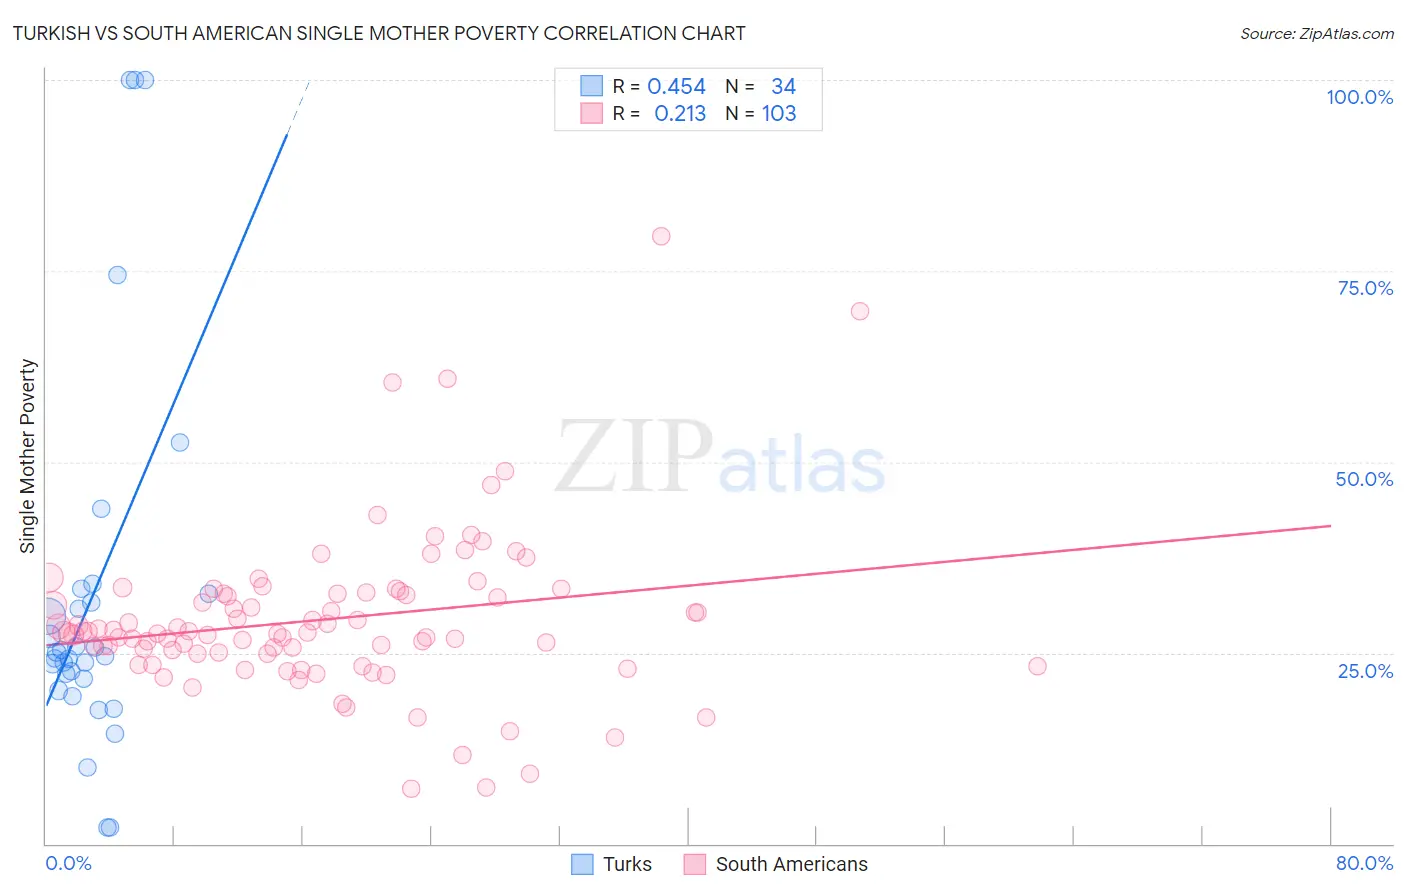
Turkish vs South American Single Mother Poverty Correlation Chart
The statistical analysis conducted on geographies consisting of 265,895,030 people shows a moderate positive correlation between the proportion of Turks and poverty level among single mothers in the United States with a correlation coefficient (R) of 0.454 and weighted average of 26.4%. Similarly, the statistical analysis conducted on geographies consisting of 477,647,095 people shows a weak positive correlation between the proportion of South Americans and poverty level among single mothers in the United States with a correlation coefficient (R) of 0.213 and weighted average of 28.4%, a difference of 7.4%.
Single Mother Poverty Correlation Summary
| Measurement | Turkish | South American |
| Minimum | 2.2% | 7.3% |
| Maximum | 100.0% | 79.6% |
| Range | 97.8% | 72.3% |
| Mean | 32.5% | 29.3% |
| Median | 24.8% | 27.6% |
| Interquartile 25% (IQ1) | 21.6% | 24.9% |
| Interquartile 75% (IQ3) | 32.8% | 32.8% |
| Interquartile Range (IQR) | 11.2% | 7.9% |
| Standard Deviation (Sample) | 24.9% | 10.7% |
| Standard Deviation (Population) | 24.5% | 10.6% |
Similar Demographics by Single Mother Poverty
Demographics Similar to Turks by Single Mother Poverty
In terms of single mother poverty, the demographic groups most similar to Turks are Jordanian (26.4%, a difference of 0.090%), Korean (26.4%, a difference of 0.14%), Immigrants from Japan (26.4%, a difference of 0.15%), Immigrants from Philippines (26.5%, a difference of 0.16%), and Immigrants from Sri Lanka (26.3%, a difference of 0.38%).
| Demographics | Rating | Rank | Single Mother Poverty |
| Burmese | 100.0 /100 | #23 | Exceptional 26.2% |
| Immigrants | Moldova | 100.0 /100 | #24 | Exceptional 26.2% |
| Immigrants | Asia | 100.0 /100 | #25 | Exceptional 26.3% |
| Immigrants | Sri Lanka | 100.0 /100 | #26 | Exceptional 26.3% |
| Immigrants | Japan | 100.0 /100 | #27 | Exceptional 26.4% |
| Koreans | 100.0 /100 | #28 | Exceptional 26.4% |
| Jordanians | 100.0 /100 | #29 | Exceptional 26.4% |
| Turks | 100.0 /100 | #30 | Exceptional 26.4% |
| Immigrants | Philippines | 100.0 /100 | #31 | Exceptional 26.5% |
| Tongans | 99.9 /100 | #32 | Exceptional 26.5% |
| Bulgarians | 99.9 /100 | #33 | Exceptional 26.5% |
| Immigrants | Indonesia | 99.9 /100 | #34 | Exceptional 26.6% |
| Maltese | 99.9 /100 | #35 | Exceptional 26.6% |
| Okinawans | 99.9 /100 | #36 | Exceptional 26.6% |
| Immigrants | Israel | 99.9 /100 | #37 | Exceptional 26.6% |
Demographics Similar to South Americans by Single Mother Poverty
In terms of single mother poverty, the demographic groups most similar to South Americans are Norwegian (28.4%, a difference of 0.0%), Immigrants from England (28.4%, a difference of 0.020%), Immigrants from Austria (28.4%, a difference of 0.020%), Polish (28.4%, a difference of 0.060%), and Kenyan (28.4%, a difference of 0.070%).
| Demographics | Rating | Rank | Single Mother Poverty |
| Colombians | 91.8 /100 | #122 | Exceptional 28.3% |
| Uruguayans | 91.7 /100 | #123 | Exceptional 28.3% |
| Immigrants | Switzerland | 91.7 /100 | #124 | Exceptional 28.3% |
| Kenyans | 90.9 /100 | #125 | Exceptional 28.4% |
| Immigrants | Chile | 90.8 /100 | #126 | Exceptional 28.4% |
| Poles | 90.8 /100 | #127 | Exceptional 28.4% |
| Immigrants | England | 90.5 /100 | #128 | Exceptional 28.4% |
| South Americans | 90.4 /100 | #129 | Exceptional 28.4% |
| Norwegians | 90.4 /100 | #130 | Exceptional 28.4% |
| Immigrants | Austria | 90.3 /100 | #131 | Exceptional 28.4% |
| Immigrants | Morocco | 89.5 /100 | #132 | Excellent 28.4% |
| Swedes | 89.4 /100 | #133 | Excellent 28.4% |
| Immigrants | Southern Europe | 89.2 /100 | #134 | Excellent 28.4% |
| Immigrants | Spain | 89.2 /100 | #135 | Excellent 28.4% |
| Native Hawaiians | 88.9 /100 | #136 | Excellent 28.4% |