Turkish vs Central American Indian Single Male Poverty
COMPARE
Turkish
Central American Indian
Single Male Poverty
Single Male Poverty Comparison
Turks
Central American Indians
12.1%
SINGLE MALE POVERTY
98.5/ 100
METRIC RATING
85th/ 347
METRIC RANK
17.2%
SINGLE MALE POVERTY
0.0/ 100
METRIC RATING
326th/ 347
METRIC RANK
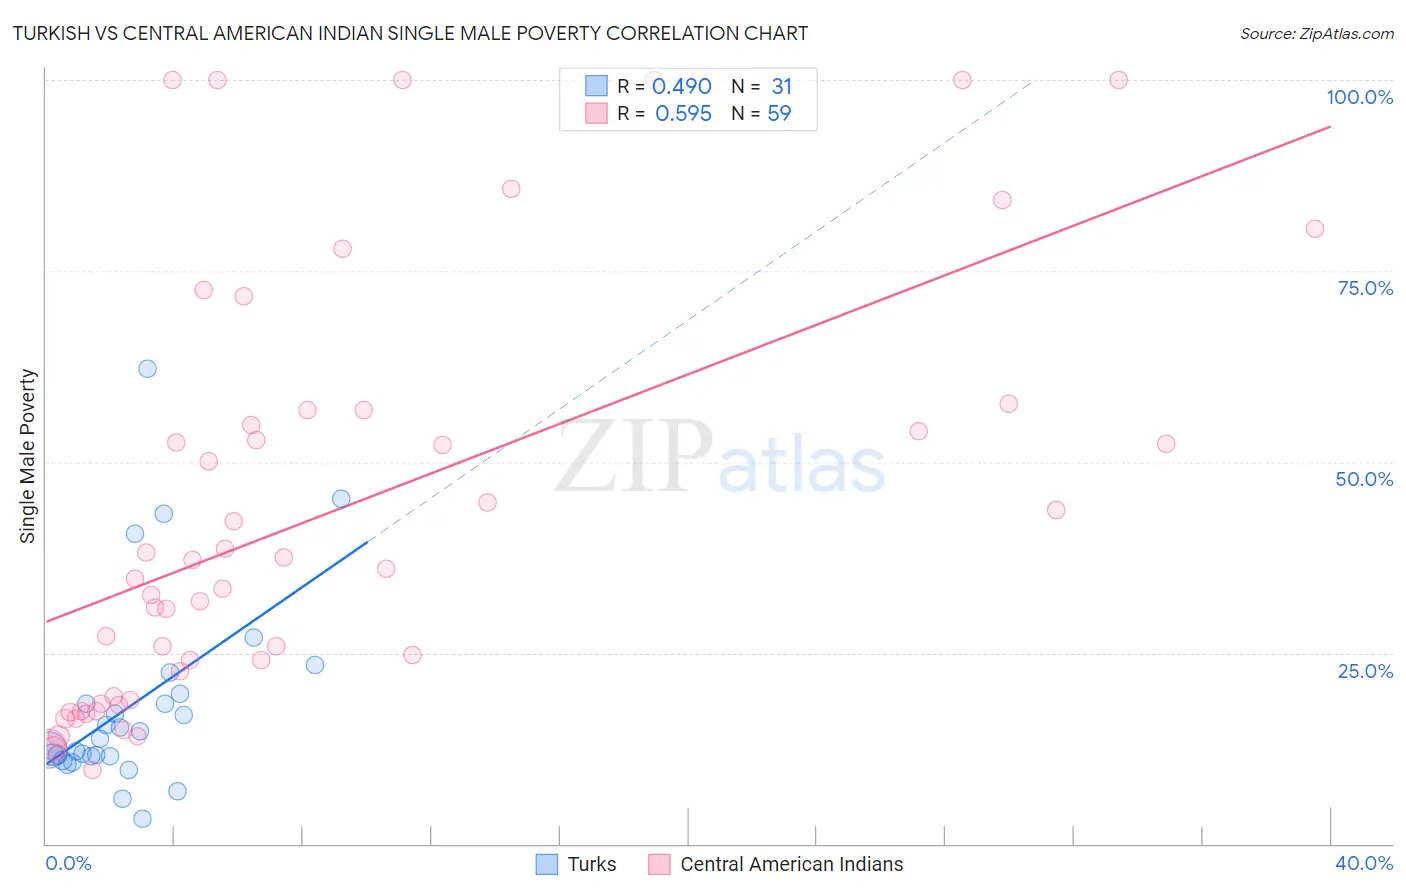
Turkish vs Central American Indian Single Male Poverty Correlation Chart
The statistical analysis conducted on geographies consisting of 244,728,482 people shows a moderate positive correlation between the proportion of Turks and poverty level among single males in the United States with a correlation coefficient (R) of 0.490 and weighted average of 12.1%. Similarly, the statistical analysis conducted on geographies consisting of 299,936,739 people shows a substantial positive correlation between the proportion of Central American Indians and poverty level among single males in the United States with a correlation coefficient (R) of 0.595 and weighted average of 17.2%, a difference of 42.6%.
Single Male Poverty Correlation Summary
| Measurement | Turkish | Central American Indian |
| Minimum | 3.3% | 9.7% |
| Maximum | 62.2% | 100.0% |
| Range | 58.9% | 90.3% |
| Mean | 18.2% | 43.3% |
| Median | 13.8% | 36.0% |
| Interquartile 25% (IQ1) | 11.4% | 18.8% |
| Interquartile 75% (IQ3) | 19.6% | 56.8% |
| Interquartile Range (IQR) | 8.2% | 38.0% |
| Standard Deviation (Sample) | 13.0% | 27.4% |
| Standard Deviation (Population) | 12.8% | 27.2% |
Similar Demographics by Single Male Poverty
Demographics Similar to Turks by Single Male Poverty
In terms of single male poverty, the demographic groups most similar to Turks are Immigrants from Israel (12.1%, a difference of 0.020%), South American (12.1%, a difference of 0.030%), Immigrants from Eritrea (12.1%, a difference of 0.040%), Immigrants from Czechoslovakia (12.1%, a difference of 0.080%), and Immigrants from Colombia (12.1%, a difference of 0.10%).
| Demographics | Rating | Rank | Single Male Poverty |
| Immigrants | Venezuela | 99.1 /100 | #78 | Exceptional 12.0% |
| Immigrants | Belgium | 99.0 /100 | #79 | Exceptional 12.0% |
| Armenians | 98.7 /100 | #80 | Exceptional 12.1% |
| Immigrants | South America | 98.7 /100 | #81 | Exceptional 12.1% |
| Immigrants | Colombia | 98.6 /100 | #82 | Exceptional 12.1% |
| Immigrants | Chile | 98.6 /100 | #83 | Exceptional 12.1% |
| Immigrants | Czechoslovakia | 98.6 /100 | #84 | Exceptional 12.1% |
| Turks | 98.5 /100 | #85 | Exceptional 12.1% |
| Immigrants | Israel | 98.5 /100 | #86 | Exceptional 12.1% |
| South Americans | 98.5 /100 | #87 | Exceptional 12.1% |
| Immigrants | Eritrea | 98.5 /100 | #88 | Exceptional 12.1% |
| Immigrants | Ireland | 98.3 /100 | #89 | Exceptional 12.1% |
| South American Indians | 98.3 /100 | #90 | Exceptional 12.1% |
| Immigrants | Turkey | 98.2 /100 | #91 | Exceptional 12.1% |
| Spanish American Indians | 98.0 /100 | #92 | Exceptional 12.1% |
Demographics Similar to Central American Indians by Single Male Poverty
In terms of single male poverty, the demographic groups most similar to Central American Indians are Choctaw (17.0%, a difference of 1.6%), Immigrants from Yemen (16.9%, a difference of 2.3%), Creek (16.8%, a difference of 2.4%), Menominee (17.7%, a difference of 2.7%), and Shoshone (16.7%, a difference of 3.5%).
| Demographics | Rating | Rank | Single Male Poverty |
| Chippewa | 0.0 /100 | #319 | Tragic 16.4% |
| Marshallese | 0.0 /100 | #320 | Tragic 16.4% |
| Osage | 0.0 /100 | #321 | Tragic 16.5% |
| Shoshone | 0.0 /100 | #322 | Tragic 16.7% |
| Creek | 0.0 /100 | #323 | Tragic 16.8% |
| Immigrants | Yemen | 0.0 /100 | #324 | Tragic 16.9% |
| Choctaw | 0.0 /100 | #325 | Tragic 17.0% |
| Central American Indians | 0.0 /100 | #326 | Tragic 17.2% |
| Menominee | 0.0 /100 | #327 | Tragic 17.7% |
| Kiowa | 0.0 /100 | #328 | Tragic 18.3% |
| Colville | 0.0 /100 | #329 | Tragic 18.4% |
| Cajuns | 0.0 /100 | #330 | Tragic 19.1% |
| Paiute | 0.0 /100 | #331 | Tragic 19.3% |
| Natives/Alaskans | 0.0 /100 | #332 | Tragic 19.6% |
| Inupiat | 0.0 /100 | #333 | Tragic 20.0% |