Potawatomi vs Central American Indian Single Male Poverty
COMPARE
Potawatomi
Central American Indian
Single Male Poverty
Single Male Poverty Comparison
Potawatomi
Central American Indians
15.8%
SINGLE MALE POVERTY
0.0/ 100
METRIC RATING
308th/ 347
METRIC RANK
17.2%
SINGLE MALE POVERTY
0.0/ 100
METRIC RATING
326th/ 347
METRIC RANK
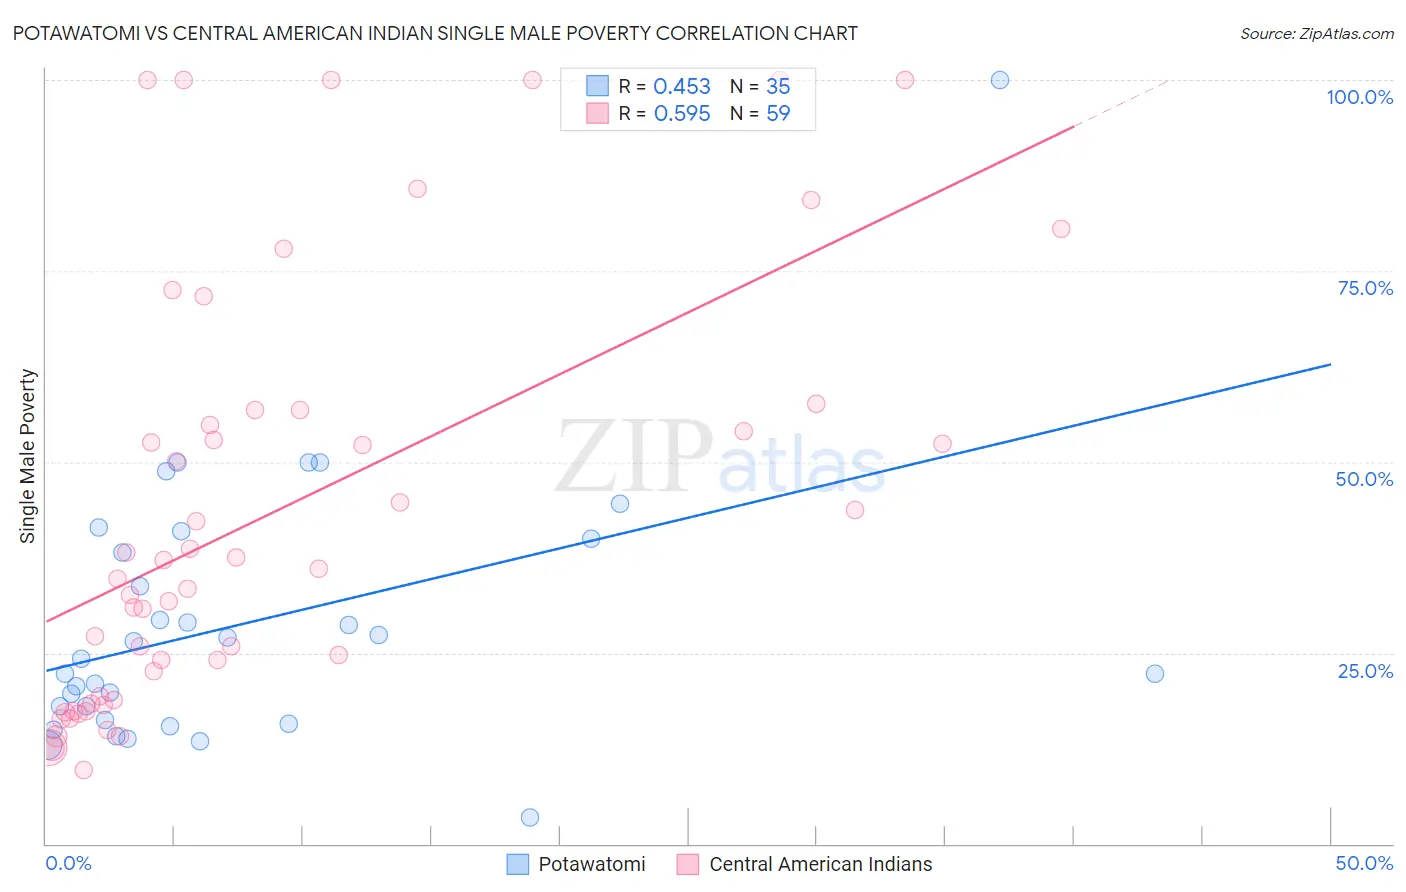
Potawatomi vs Central American Indian Single Male Poverty Correlation Chart
The statistical analysis conducted on geographies consisting of 112,014,628 people shows a moderate positive correlation between the proportion of Potawatomi and poverty level among single males in the United States with a correlation coefficient (R) of 0.453 and weighted average of 15.8%. Similarly, the statistical analysis conducted on geographies consisting of 299,936,739 people shows a substantial positive correlation between the proportion of Central American Indians and poverty level among single males in the United States with a correlation coefficient (R) of 0.595 and weighted average of 17.2%, a difference of 9.4%.
Single Male Poverty Correlation Summary
| Measurement | Potawatomi | Central American Indian |
| Minimum | 3.4% | 9.7% |
| Maximum | 100.0% | 100.0% |
| Range | 96.6% | 90.3% |
| Mean | 28.9% | 43.3% |
| Median | 24.3% | 36.0% |
| Interquartile 25% (IQ1) | 16.3% | 18.8% |
| Interquartile 75% (IQ3) | 40.0% | 56.8% |
| Interquartile Range (IQR) | 23.7% | 38.0% |
| Standard Deviation (Sample) | 17.6% | 27.4% |
| Standard Deviation (Population) | 17.3% | 27.2% |
Demographics Similar to Potawatomi and Central American Indians by Single Male Poverty
In terms of single male poverty, the demographic groups most similar to Potawatomi are American (15.8%, a difference of 0.17%), Ute (15.7%, a difference of 0.57%), Yakama (15.9%, a difference of 1.0%), Seminole (16.0%, a difference of 1.6%), and Comanche (16.0%, a difference of 1.6%). Similarly, the demographic groups most similar to Central American Indians are Choctaw (17.0%, a difference of 1.6%), Immigrants from Yemen (16.9%, a difference of 2.3%), Creek (16.8%, a difference of 2.4%), Menominee (17.7%, a difference of 2.7%), and Shoshone (16.7%, a difference of 3.5%).
| Demographics | Rating | Rank | Single Male Poverty |
| Ute | 0.0 /100 | #307 | Tragic 15.7% |
| Potawatomi | 0.0 /100 | #308 | Tragic 15.8% |
| Americans | 0.0 /100 | #309 | Tragic 15.8% |
| Yakama | 0.0 /100 | #310 | Tragic 15.9% |
| Seminole | 0.0 /100 | #311 | Tragic 16.0% |
| Comanche | 0.0 /100 | #312 | Tragic 16.0% |
| Cherokee | 0.0 /100 | #313 | Tragic 16.1% |
| Alaskan Athabascans | 0.0 /100 | #314 | Tragic 16.1% |
| Cheyenne | 0.0 /100 | #315 | Tragic 16.1% |
| Dutch West Indians | 0.0 /100 | #316 | Tragic 16.1% |
| Blacks/African Americans | 0.0 /100 | #317 | Tragic 16.2% |
| Chickasaw | 0.0 /100 | #318 | Tragic 16.3% |
| Chippewa | 0.0 /100 | #319 | Tragic 16.4% |
| Marshallese | 0.0 /100 | #320 | Tragic 16.4% |
| Osage | 0.0 /100 | #321 | Tragic 16.5% |
| Shoshone | 0.0 /100 | #322 | Tragic 16.7% |
| Creek | 0.0 /100 | #323 | Tragic 16.8% |
| Immigrants | Yemen | 0.0 /100 | #324 | Tragic 16.9% |
| Choctaw | 0.0 /100 | #325 | Tragic 17.0% |
| Central American Indians | 0.0 /100 | #326 | Tragic 17.2% |
| Menominee | 0.0 /100 | #327 | Tragic 17.7% |