Syrian vs Vietnamese Single Father Poverty
COMPARE
Syrian
Vietnamese
Single Father Poverty
Single Father Poverty Comparison
Syrians
Vietnamese
16.6%
SINGLE FATHER POVERTY
17.4/ 100
METRIC RATING
200th/ 347
METRIC RANK
16.3%
SINGLE FATHER POVERTY
48.0/ 100
METRIC RATING
176th/ 347
METRIC RANK
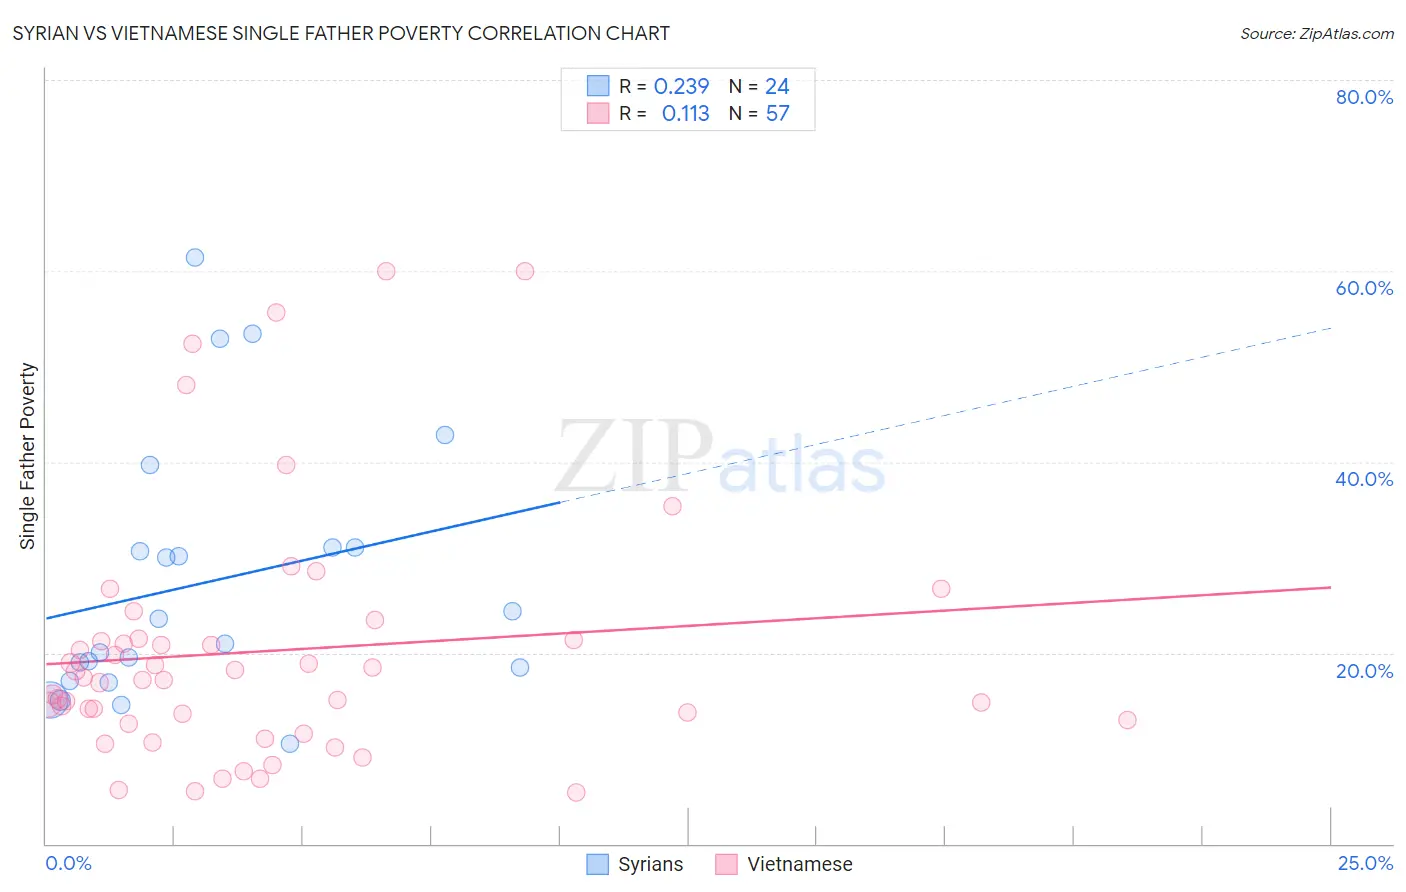
Syrian vs Vietnamese Single Father Poverty Correlation Chart
The statistical analysis conducted on geographies consisting of 216,304,035 people shows a weak positive correlation between the proportion of Syrians and poverty level among single fathers in the United States with a correlation coefficient (R) of 0.239 and weighted average of 16.6%. Similarly, the statistical analysis conducted on geographies consisting of 147,063,845 people shows a poor positive correlation between the proportion of Vietnamese and poverty level among single fathers in the United States with a correlation coefficient (R) of 0.113 and weighted average of 16.3%, a difference of 1.6%.
Single Father Poverty Correlation Summary
| Measurement | Syrian | Vietnamese |
| Minimum | 10.4% | 5.4% |
| Maximum | 61.3% | 60.0% |
| Range | 50.9% | 54.6% |
| Mean | 27.4% | 20.2% |
| Median | 22.2% | 17.2% |
| Interquartile 25% (IQ1) | 17.7% | 12.7% |
| Interquartile 75% (IQ3) | 31.0% | 21.4% |
| Interquartile Range (IQR) | 13.3% | 8.6% |
| Standard Deviation (Sample) | 13.7% | 13.0% |
| Standard Deviation (Population) | 13.4% | 12.9% |
Similar Demographics by Single Father Poverty
Demographics Similar to Syrians by Single Father Poverty
In terms of single father poverty, the demographic groups most similar to Syrians are Cuban (16.6%, a difference of 0.070%), Immigrants from Croatia (16.6%, a difference of 0.070%), Immigrants from Belize (16.5%, a difference of 0.17%), Romanian (16.5%, a difference of 0.19%), and Immigrants from North America (16.6%, a difference of 0.19%).
| Demographics | Rating | Rank | Single Father Poverty |
| Ecuadorians | 24.5 /100 | #193 | Fair 16.5% |
| Cape Verdeans | 24.4 /100 | #194 | Fair 16.5% |
| Immigrants | Barbados | 24.3 /100 | #195 | Fair 16.5% |
| Immigrants | Canada | 21.9 /100 | #196 | Fair 16.5% |
| Immigrants | Northern Europe | 20.3 /100 | #197 | Fair 16.5% |
| Romanians | 20.1 /100 | #198 | Fair 16.5% |
| Immigrants | Belize | 19.8 /100 | #199 | Poor 16.5% |
| Syrians | 17.4 /100 | #200 | Poor 16.6% |
| Cubans | 16.5 /100 | #201 | Poor 16.6% |
| Immigrants | Croatia | 16.5 /100 | #202 | Poor 16.6% |
| Immigrants | North America | 15.1 /100 | #203 | Poor 16.6% |
| Immigrants | Guatemala | 14.8 /100 | #204 | Poor 16.6% |
| Venezuelans | 14.3 /100 | #205 | Poor 16.6% |
| Immigrants | Senegal | 13.7 /100 | #206 | Poor 16.6% |
| New Zealanders | 13.7 /100 | #207 | Poor 16.6% |
Demographics Similar to Vietnamese by Single Father Poverty
In terms of single father poverty, the demographic groups most similar to Vietnamese are Immigrants from Ecuador (16.3%, a difference of 0.070%), Immigrants from Sierra Leone (16.3%, a difference of 0.090%), Immigrants from St. Vincent and the Grenadines (16.3%, a difference of 0.090%), Swedish (16.3%, a difference of 0.090%), and Immigrants from Morocco (16.3%, a difference of 0.12%).
| Demographics | Rating | Rank | Single Father Poverty |
| Northern Europeans | 52.8 /100 | #169 | Average 16.3% |
| Scandinavians | 52.3 /100 | #170 | Average 16.3% |
| Immigrants | Morocco | 50.7 /100 | #171 | Average 16.3% |
| Immigrants | Sierra Leone | 50.1 /100 | #172 | Average 16.3% |
| Immigrants | St. Vincent and the Grenadines | 50.0 /100 | #173 | Average 16.3% |
| Swedes | 50.0 /100 | #174 | Average 16.3% |
| Immigrants | Ecuador | 49.7 /100 | #175 | Average 16.3% |
| Vietnamese | 48.0 /100 | #176 | Average 16.3% |
| Immigrants | South Africa | 44.2 /100 | #177 | Average 16.3% |
| Immigrants | Cuba | 41.6 /100 | #178 | Average 16.4% |
| Serbians | 40.9 /100 | #179 | Average 16.4% |
| Immigrants | Latin America | 37.2 /100 | #180 | Fair 16.4% |
| Immigrants | Western Africa | 36.0 /100 | #181 | Fair 16.4% |
| Immigrants | Italy | 35.7 /100 | #182 | Fair 16.4% |
| Aleuts | 35.3 /100 | #183 | Fair 16.4% |