Czech vs Vietnamese Single Father Poverty
COMPARE
Czech
Vietnamese
Single Father Poverty
Single Father Poverty Comparison
Czechs
Vietnamese
17.0%
SINGLE FATHER POVERTY
2.3/ 100
METRIC RATING
241st/ 347
METRIC RANK
16.3%
SINGLE FATHER POVERTY
48.0/ 100
METRIC RATING
176th/ 347
METRIC RANK
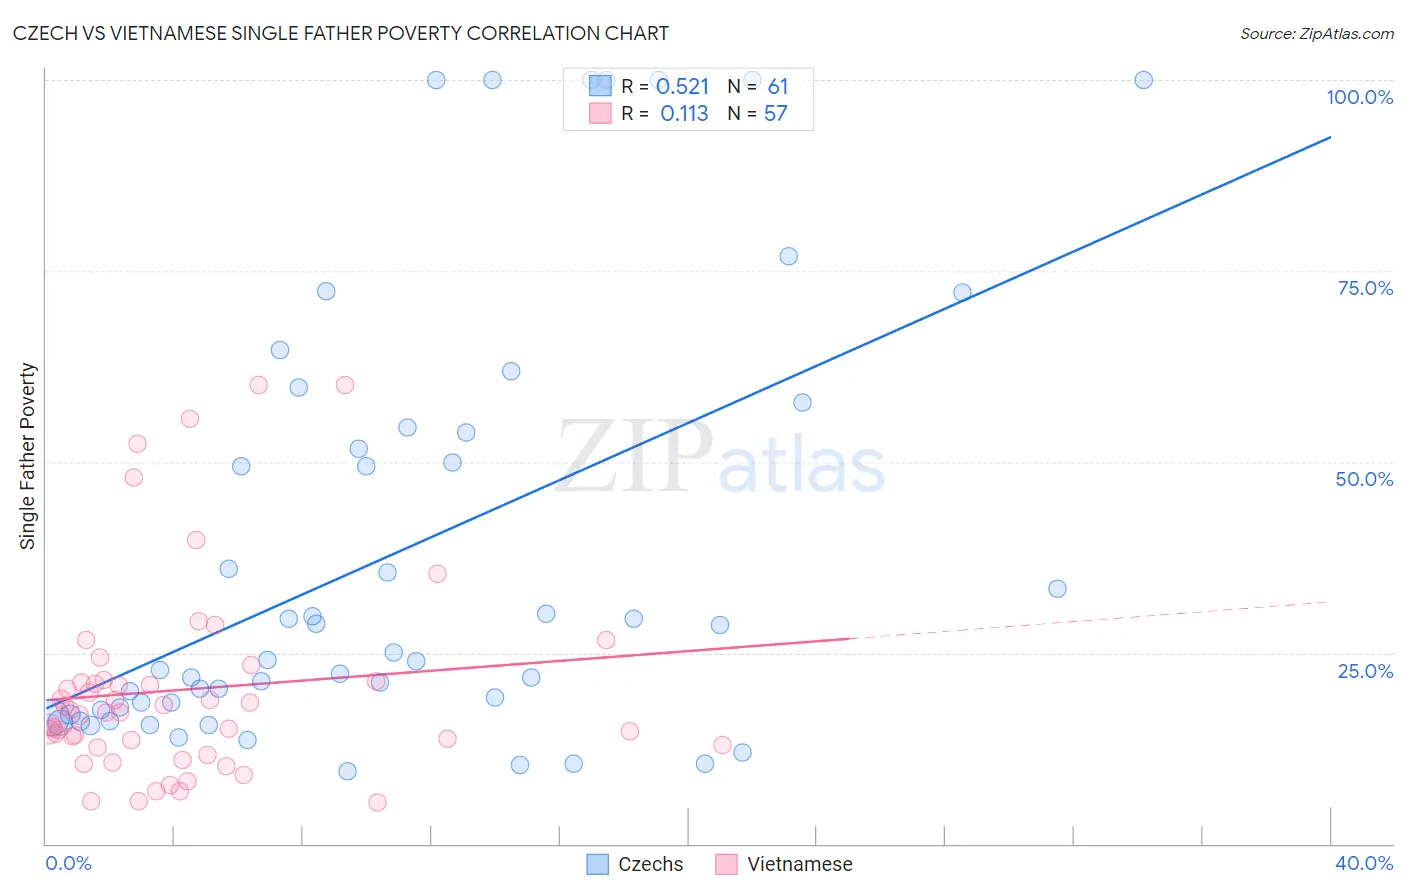
Czech vs Vietnamese Single Father Poverty Correlation Chart
The statistical analysis conducted on geographies consisting of 358,801,462 people shows a substantial positive correlation between the proportion of Czechs and poverty level among single fathers in the United States with a correlation coefficient (R) of 0.521 and weighted average of 17.0%. Similarly, the statistical analysis conducted on geographies consisting of 147,063,845 people shows a poor positive correlation between the proportion of Vietnamese and poverty level among single fathers in the United States with a correlation coefficient (R) of 0.113 and weighted average of 16.3%, a difference of 4.0%.
Single Father Poverty Correlation Summary
| Measurement | Czech | Vietnamese |
| Minimum | 9.5% | 5.4% |
| Maximum | 100.0% | 60.0% |
| Range | 90.5% | 54.6% |
| Mean | 38.0% | 20.2% |
| Median | 24.1% | 17.2% |
| Interquartile 25% (IQ1) | 17.3% | 12.7% |
| Interquartile 75% (IQ3) | 54.2% | 21.4% |
| Interquartile Range (IQR) | 36.9% | 8.6% |
| Standard Deviation (Sample) | 28.4% | 13.0% |
| Standard Deviation (Population) | 28.2% | 12.9% |
Similar Demographics by Single Father Poverty
Demographics Similar to Czechs by Single Father Poverty
In terms of single father poverty, the demographic groups most similar to Czechs are Moroccan (17.0%, a difference of 0.10%), Finnish (16.9%, a difference of 0.12%), Bermudan (16.9%, a difference of 0.13%), Immigrants from Saudi Arabia (16.9%, a difference of 0.15%), and Subsaharan African (16.9%, a difference of 0.22%).
| Demographics | Rating | Rank | Single Father Poverty |
| Marshallese | 3.1 /100 | #234 | Tragic 16.9% |
| Immigrants | Western Europe | 2.9 /100 | #235 | Tragic 16.9% |
| Immigrants | Germany | 2.9 /100 | #236 | Tragic 16.9% |
| Sub-Saharan Africans | 2.9 /100 | #237 | Tragic 16.9% |
| Immigrants | Saudi Arabia | 2.7 /100 | #238 | Tragic 16.9% |
| Bermudans | 2.6 /100 | #239 | Tragic 16.9% |
| Finns | 2.6 /100 | #240 | Tragic 16.9% |
| Czechs | 2.3 /100 | #241 | Tragic 17.0% |
| Moroccans | 2.1 /100 | #242 | Tragic 17.0% |
| Immigrants | Cabo Verde | 1.6 /100 | #243 | Tragic 17.0% |
| Hondurans | 1.6 /100 | #244 | Tragic 17.0% |
| Trinidadians and Tobagonians | 1.5 /100 | #245 | Tragic 17.0% |
| Immigrants | Ireland | 1.4 /100 | #246 | Tragic 17.1% |
| Greeks | 1.3 /100 | #247 | Tragic 17.1% |
| Czechoslovakians | 1.3 /100 | #248 | Tragic 17.1% |
Demographics Similar to Vietnamese by Single Father Poverty
In terms of single father poverty, the demographic groups most similar to Vietnamese are Immigrants from Ecuador (16.3%, a difference of 0.070%), Immigrants from Sierra Leone (16.3%, a difference of 0.090%), Immigrants from St. Vincent and the Grenadines (16.3%, a difference of 0.090%), Swedish (16.3%, a difference of 0.090%), and Immigrants from Morocco (16.3%, a difference of 0.12%).
| Demographics | Rating | Rank | Single Father Poverty |
| Northern Europeans | 52.8 /100 | #169 | Average 16.3% |
| Scandinavians | 52.3 /100 | #170 | Average 16.3% |
| Immigrants | Morocco | 50.7 /100 | #171 | Average 16.3% |
| Immigrants | Sierra Leone | 50.1 /100 | #172 | Average 16.3% |
| Immigrants | St. Vincent and the Grenadines | 50.0 /100 | #173 | Average 16.3% |
| Swedes | 50.0 /100 | #174 | Average 16.3% |
| Immigrants | Ecuador | 49.7 /100 | #175 | Average 16.3% |
| Vietnamese | 48.0 /100 | #176 | Average 16.3% |
| Immigrants | South Africa | 44.2 /100 | #177 | Average 16.3% |
| Immigrants | Cuba | 41.6 /100 | #178 | Average 16.4% |
| Serbians | 40.9 /100 | #179 | Average 16.4% |
| Immigrants | Latin America | 37.2 /100 | #180 | Fair 16.4% |
| Immigrants | Western Africa | 36.0 /100 | #181 | Fair 16.4% |
| Immigrants | Italy | 35.7 /100 | #182 | Fair 16.4% |
| Aleuts | 35.3 /100 | #183 | Fair 16.4% |