Navajo vs Vietnamese Single Father Poverty
COMPARE
Navajo
Vietnamese
Single Father Poverty
Single Father Poverty Comparison
Navajo
Vietnamese
29.2%
SINGLE FATHER POVERTY
0.0/ 100
METRIC RATING
344th/ 347
METRIC RANK
16.3%
SINGLE FATHER POVERTY
48.0/ 100
METRIC RATING
176th/ 347
METRIC RANK
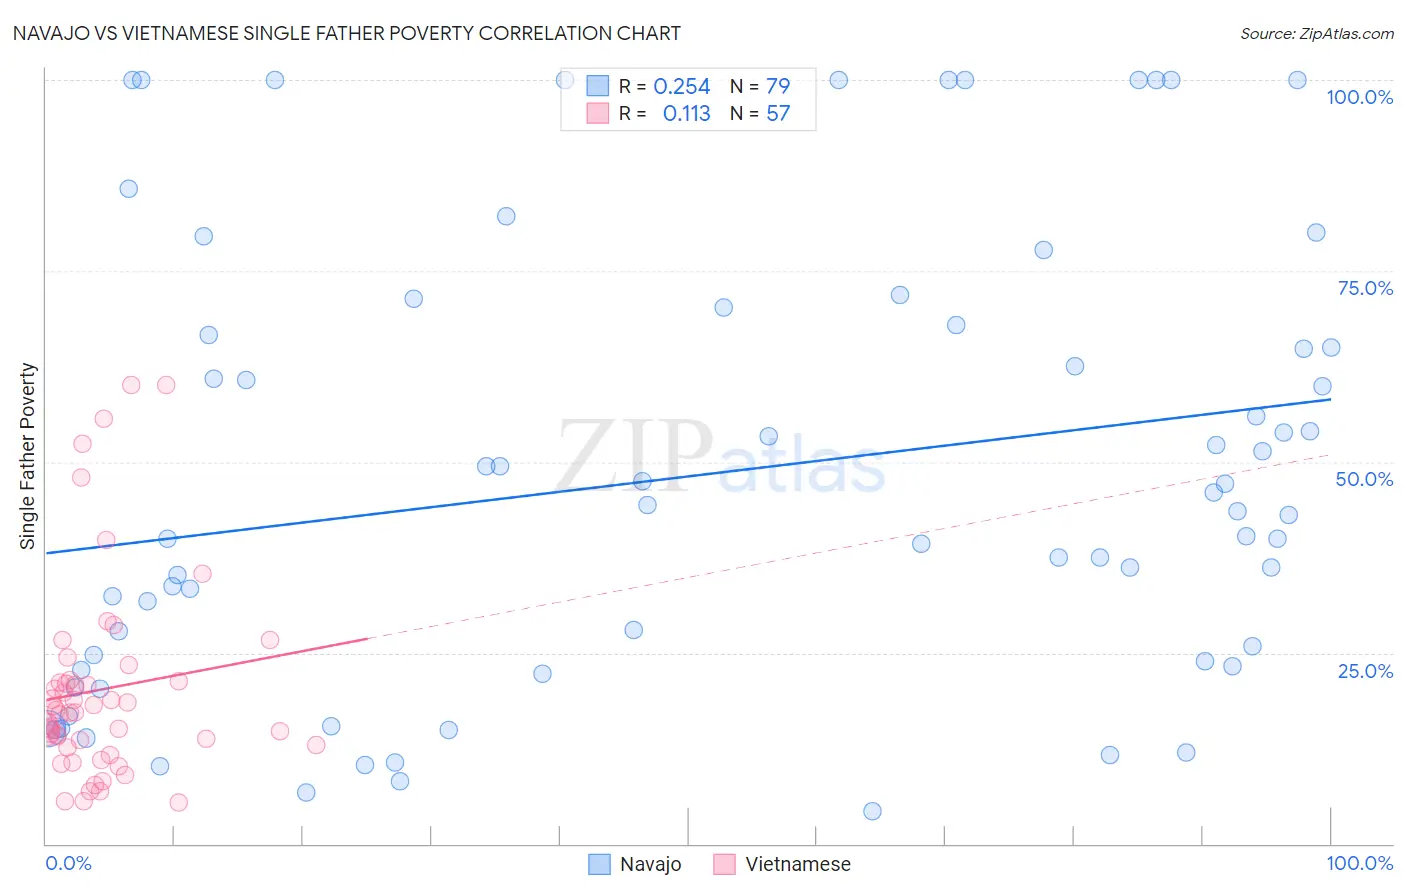
Navajo vs Vietnamese Single Father Poverty Correlation Chart
The statistical analysis conducted on geographies consisting of 195,813,521 people shows a weak positive correlation between the proportion of Navajo and poverty level among single fathers in the United States with a correlation coefficient (R) of 0.254 and weighted average of 29.2%. Similarly, the statistical analysis conducted on geographies consisting of 147,063,845 people shows a poor positive correlation between the proportion of Vietnamese and poverty level among single fathers in the United States with a correlation coefficient (R) of 0.113 and weighted average of 16.3%, a difference of 79.2%.
Single Father Poverty Correlation Summary
| Measurement | Navajo | Vietnamese |
| Minimum | 4.3% | 5.4% |
| Maximum | 100.0% | 60.0% |
| Range | 95.7% | 54.6% |
| Mean | 48.2% | 20.2% |
| Median | 43.6% | 17.2% |
| Interquartile 25% (IQ1) | 23.3% | 12.7% |
| Interquartile 75% (IQ3) | 67.9% | 21.4% |
| Interquartile Range (IQR) | 44.6% | 8.6% |
| Standard Deviation (Sample) | 29.2% | 13.0% |
| Standard Deviation (Population) | 29.0% | 12.9% |
Similar Demographics by Single Father Poverty
Demographics Similar to Navajo by Single Father Poverty
In terms of single father poverty, the demographic groups most similar to Navajo are Lumbee (28.5%, a difference of 2.6%), Yuman (28.4%, a difference of 2.9%), Crow (30.3%, a difference of 3.6%), Hopi (27.2%, a difference of 7.6%), and Puerto Rican (31.5%, a difference of 7.9%).
| Demographics | Rating | Rank | Single Father Poverty |
| Natives/Alaskans | 0.0 /100 | #333 | Tragic 22.4% |
| Kiowa | 0.0 /100 | #334 | Tragic 22.5% |
| Shoshone | 0.0 /100 | #335 | Tragic 22.9% |
| Cajuns | 0.0 /100 | #336 | Tragic 23.1% |
| Sioux | 0.0 /100 | #337 | Tragic 23.9% |
| Arapaho | 0.0 /100 | #338 | Tragic 24.0% |
| Apache | 0.0 /100 | #339 | Tragic 24.2% |
| Houma | 0.0 /100 | #340 | Tragic 26.7% |
| Hopi | 0.0 /100 | #341 | Tragic 27.2% |
| Yuman | 0.0 /100 | #342 | Tragic 28.4% |
| Lumbee | 0.0 /100 | #343 | Tragic 28.5% |
| Navajo | 0.0 /100 | #344 | Tragic 29.2% |
| Crow | 0.0 /100 | #345 | Tragic 30.3% |
| Puerto Ricans | 0.0 /100 | #346 | Tragic 31.5% |
| Yup'ik | 0.0 /100 | #347 | Tragic 32.5% |
Demographics Similar to Vietnamese by Single Father Poverty
In terms of single father poverty, the demographic groups most similar to Vietnamese are Immigrants from Ecuador (16.3%, a difference of 0.070%), Immigrants from Sierra Leone (16.3%, a difference of 0.090%), Immigrants from St. Vincent and the Grenadines (16.3%, a difference of 0.090%), Swedish (16.3%, a difference of 0.090%), and Immigrants from Morocco (16.3%, a difference of 0.12%).
| Demographics | Rating | Rank | Single Father Poverty |
| Northern Europeans | 52.8 /100 | #169 | Average 16.3% |
| Scandinavians | 52.3 /100 | #170 | Average 16.3% |
| Immigrants | Morocco | 50.7 /100 | #171 | Average 16.3% |
| Immigrants | Sierra Leone | 50.1 /100 | #172 | Average 16.3% |
| Immigrants | St. Vincent and the Grenadines | 50.0 /100 | #173 | Average 16.3% |
| Swedes | 50.0 /100 | #174 | Average 16.3% |
| Immigrants | Ecuador | 49.7 /100 | #175 | Average 16.3% |
| Vietnamese | 48.0 /100 | #176 | Average 16.3% |
| Immigrants | South Africa | 44.2 /100 | #177 | Average 16.3% |
| Immigrants | Cuba | 41.6 /100 | #178 | Average 16.4% |
| Serbians | 40.9 /100 | #179 | Average 16.4% |
| Immigrants | Latin America | 37.2 /100 | #180 | Fair 16.4% |
| Immigrants | Western Africa | 36.0 /100 | #181 | Fair 16.4% |
| Immigrants | Italy | 35.7 /100 | #182 | Fair 16.4% |
| Aleuts | 35.3 /100 | #183 | Fair 16.4% |