Immigrants from Sudan vs Guyanese Single Father Poverty
COMPARE
Immigrants from Sudan
Guyanese
Single Father Poverty
Single Father Poverty Comparison
Immigrants from Sudan
Guyanese
16.2%
SINGLE FATHER POVERTY
59.8/ 100
METRIC RATING
160th/ 347
METRIC RANK
16.3%
SINGLE FATHER POVERTY
55.2/ 100
METRIC RATING
164th/ 347
METRIC RANK
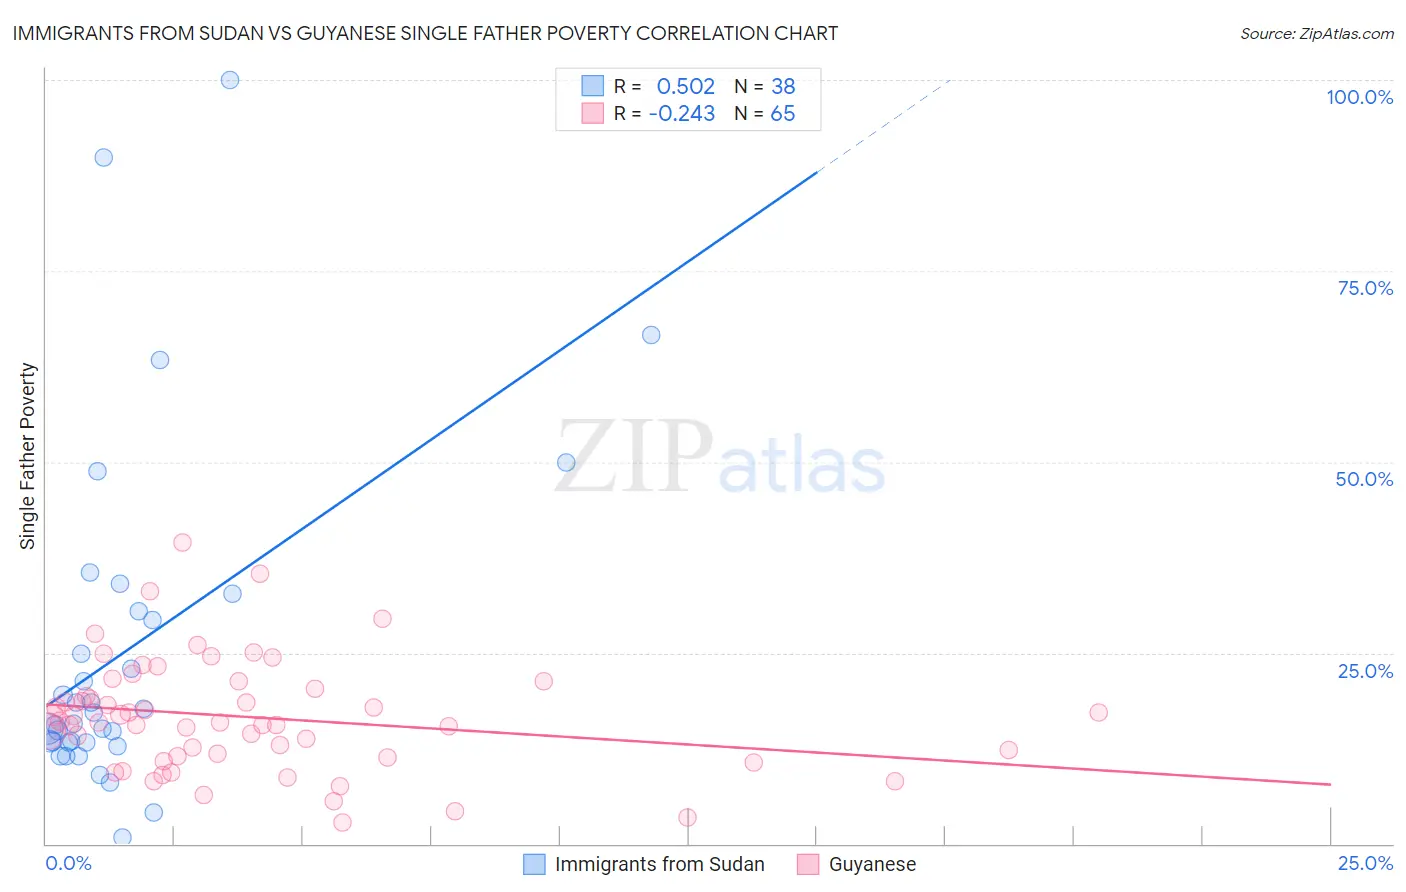
Immigrants from Sudan vs Guyanese Single Father Poverty Correlation Chart
The statistical analysis conducted on geographies consisting of 108,710,355 people shows a substantial positive correlation between the proportion of Immigrants from Sudan and poverty level among single fathers in the United States with a correlation coefficient (R) of 0.502 and weighted average of 16.2%. Similarly, the statistical analysis conducted on geographies consisting of 153,215,231 people shows a weak negative correlation between the proportion of Guyanese and poverty level among single fathers in the United States with a correlation coefficient (R) of -0.243 and weighted average of 16.3%, a difference of 0.21%.
Single Father Poverty Correlation Summary
| Measurement | Immigrants from Sudan | Guyanese |
| Minimum | 0.76% | 2.8% |
| Maximum | 100.0% | 39.5% |
| Range | 99.2% | 36.7% |
| Mean | 25.5% | 16.6% |
| Median | 16.4% | 16.0% |
| Interquartile 25% (IQ1) | 13.3% | 11.3% |
| Interquartile 75% (IQ3) | 30.5% | 20.8% |
| Interquartile Range (IQR) | 17.2% | 9.4% |
| Standard Deviation (Sample) | 22.2% | 7.4% |
| Standard Deviation (Population) | 21.9% | 7.3% |
Demographics Similar to Immigrants from Sudan and Guyanese by Single Father Poverty
In terms of single father poverty, the demographic groups most similar to Immigrants from Sudan are Belizean (16.2%, a difference of 0.010%), Portuguese (16.2%, a difference of 0.12%), Immigrants from Czechoslovakia (16.2%, a difference of 0.14%), Estonian (16.2%, a difference of 0.14%), and Ugandan (16.3%, a difference of 0.18%). Similarly, the demographic groups most similar to Guyanese are Immigrants from Bangladesh (16.3%, a difference of 0.0%), Immigrants from Europe (16.3%, a difference of 0.010%), Immigrants from Costa Rica (16.3%, a difference of 0.020%), Ugandan (16.3%, a difference of 0.030%), and Yugoslavian (16.3%, a difference of 0.060%).
| Demographics | Rating | Rank | Single Father Poverty |
| Immigrants | Zimbabwe | 72.1 /100 | #152 | Good 16.1% |
| Immigrants | Israel | 72.0 /100 | #153 | Good 16.1% |
| Mexicans | 70.1 /100 | #154 | Good 16.1% |
| Immigrants | Nicaragua | 67.8 /100 | #155 | Good 16.2% |
| Immigrants | Jordan | 66.0 /100 | #156 | Good 16.2% |
| Immigrants | Czechoslovakia | 62.8 /100 | #157 | Good 16.2% |
| Portuguese | 62.3 /100 | #158 | Good 16.2% |
| Belizeans | 59.9 /100 | #159 | Average 16.2% |
| Immigrants | Sudan | 59.8 /100 | #160 | Average 16.2% |
| Estonians | 56.7 /100 | #161 | Average 16.2% |
| Ugandans | 55.9 /100 | #162 | Average 16.3% |
| Immigrants | Costa Rica | 55.7 /100 | #163 | Average 16.3% |
| Guyanese | 55.2 /100 | #164 | Average 16.3% |
| Immigrants | Bangladesh | 55.1 /100 | #165 | Average 16.3% |
| Immigrants | Europe | 54.8 /100 | #166 | Average 16.3% |
| Yugoslavians | 53.9 /100 | #167 | Average 16.3% |
| Costa Ricans | 53.6 /100 | #168 | Average 16.3% |
| Northern Europeans | 52.8 /100 | #169 | Average 16.3% |
| Scandinavians | 52.3 /100 | #170 | Average 16.3% |
| Immigrants | Morocco | 50.7 /100 | #171 | Average 16.3% |
| Immigrants | Sierra Leone | 50.1 /100 | #172 | Average 16.3% |