Immigrants from South Central Asia vs Guyanese Single Father Poverty
COMPARE
Immigrants from South Central Asia
Guyanese
Single Father Poverty
Single Father Poverty Comparison
Immigrants from South Central Asia
Guyanese
14.5%
SINGLE FATHER POVERTY
100.0/ 100
METRIC RATING
28th/ 347
METRIC RANK
16.3%
SINGLE FATHER POVERTY
55.2/ 100
METRIC RATING
164th/ 347
METRIC RANK
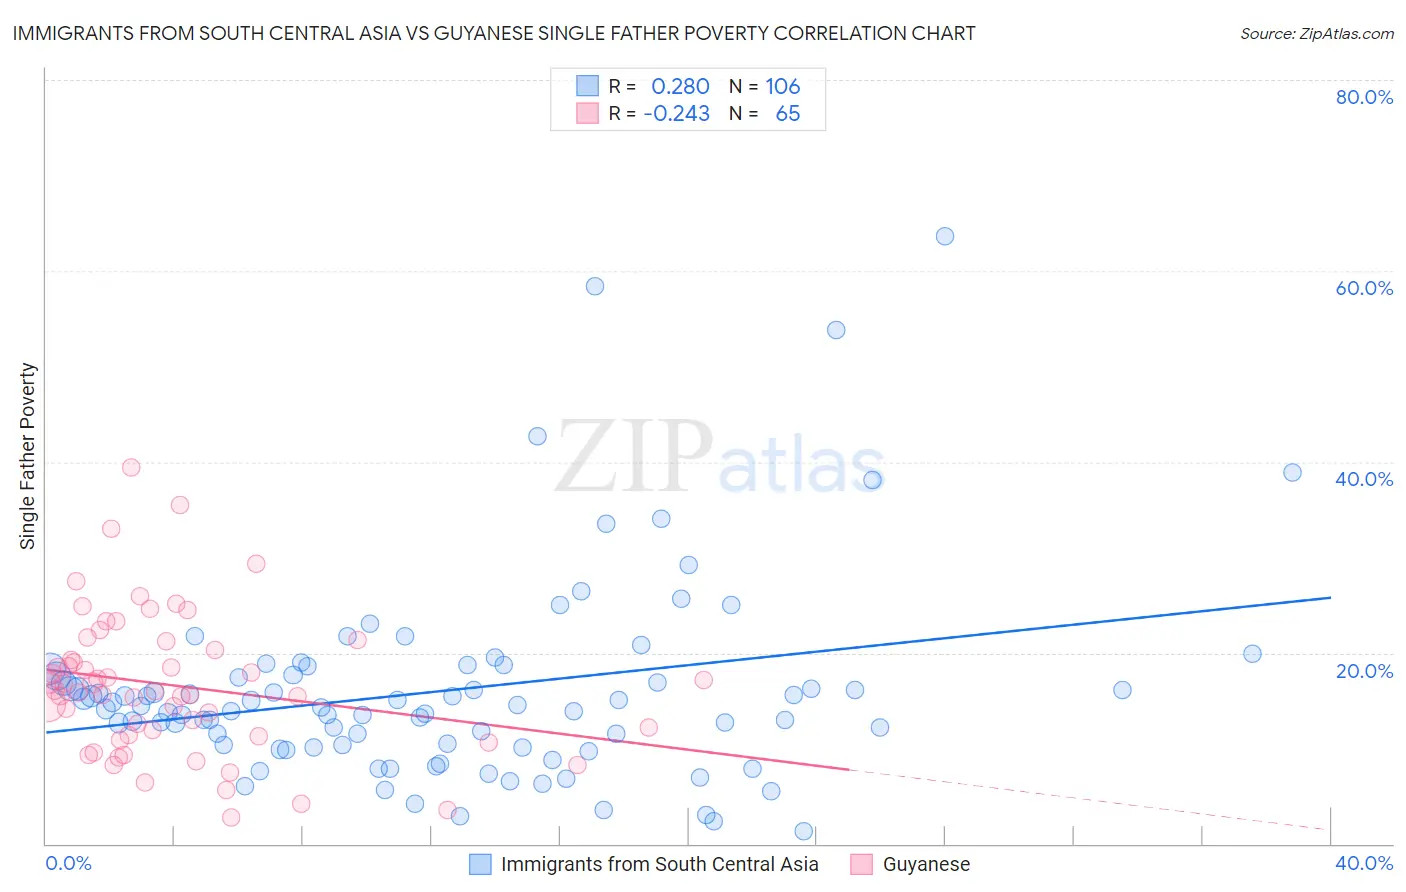
Immigrants from South Central Asia vs Guyanese Single Father Poverty Correlation Chart
The statistical analysis conducted on geographies consisting of 359,481,520 people shows a weak positive correlation between the proportion of Immigrants from South Central Asia and poverty level among single fathers in the United States with a correlation coefficient (R) of 0.280 and weighted average of 14.5%. Similarly, the statistical analysis conducted on geographies consisting of 153,215,231 people shows a weak negative correlation between the proportion of Guyanese and poverty level among single fathers in the United States with a correlation coefficient (R) of -0.243 and weighted average of 16.3%, a difference of 12.1%.
Single Father Poverty Correlation Summary
| Measurement | Immigrants from South Central Asia | Guyanese |
| Minimum | 1.4% | 2.8% |
| Maximum | 63.6% | 39.5% |
| Range | 62.3% | 36.7% |
| Mean | 16.0% | 16.6% |
| Median | 14.3% | 16.0% |
| Interquartile 25% (IQ1) | 10.4% | 11.3% |
| Interquartile 75% (IQ3) | 17.7% | 20.8% |
| Interquartile Range (IQR) | 7.3% | 9.4% |
| Standard Deviation (Sample) | 10.4% | 7.4% |
| Standard Deviation (Population) | 10.4% | 7.3% |
Similar Demographics by Single Father Poverty
Demographics Similar to Immigrants from South Central Asia by Single Father Poverty
In terms of single father poverty, the demographic groups most similar to Immigrants from South Central Asia are Somali (14.5%, a difference of 0.11%), Thai (14.5%, a difference of 0.15%), Icelander (14.5%, a difference of 0.23%), Asian (14.6%, a difference of 0.38%), and Nepalese (14.4%, a difference of 0.53%).
| Demographics | Rating | Rank | Single Father Poverty |
| Immigrants | Afghanistan | 100.0 /100 | #21 | Exceptional 14.3% |
| Taiwanese | 100.0 /100 | #22 | Exceptional 14.3% |
| Immigrants | Egypt | 100.0 /100 | #23 | Exceptional 14.4% |
| Immigrants | South Eastern Asia | 100.0 /100 | #24 | Exceptional 14.4% |
| Iranians | 100.0 /100 | #25 | Exceptional 14.4% |
| Spanish American Indians | 100.0 /100 | #26 | Exceptional 14.4% |
| Nepalese | 100.0 /100 | #27 | Exceptional 14.4% |
| Immigrants | South Central Asia | 100.0 /100 | #28 | Exceptional 14.5% |
| Somalis | 100.0 /100 | #29 | Exceptional 14.5% |
| Thais | 100.0 /100 | #30 | Exceptional 14.5% |
| Icelanders | 100.0 /100 | #31 | Exceptional 14.5% |
| Asians | 100.0 /100 | #32 | Exceptional 14.6% |
| Okinawans | 100.0 /100 | #33 | Exceptional 14.6% |
| Egyptians | 100.0 /100 | #34 | Exceptional 14.7% |
| Immigrants | Bolivia | 100.0 /100 | #35 | Exceptional 14.7% |
Demographics Similar to Guyanese by Single Father Poverty
In terms of single father poverty, the demographic groups most similar to Guyanese are Immigrants from Bangladesh (16.3%, a difference of 0.0%), Immigrants from Europe (16.3%, a difference of 0.010%), Immigrants from Costa Rica (16.3%, a difference of 0.020%), Ugandan (16.3%, a difference of 0.030%), and Yugoslavian (16.3%, a difference of 0.060%).
| Demographics | Rating | Rank | Single Father Poverty |
| Immigrants | Czechoslovakia | 62.8 /100 | #157 | Good 16.2% |
| Portuguese | 62.3 /100 | #158 | Good 16.2% |
| Belizeans | 59.9 /100 | #159 | Average 16.2% |
| Immigrants | Sudan | 59.8 /100 | #160 | Average 16.2% |
| Estonians | 56.7 /100 | #161 | Average 16.2% |
| Ugandans | 55.9 /100 | #162 | Average 16.3% |
| Immigrants | Costa Rica | 55.7 /100 | #163 | Average 16.3% |
| Guyanese | 55.2 /100 | #164 | Average 16.3% |
| Immigrants | Bangladesh | 55.1 /100 | #165 | Average 16.3% |
| Immigrants | Europe | 54.8 /100 | #166 | Average 16.3% |
| Yugoslavians | 53.9 /100 | #167 | Average 16.3% |
| Costa Ricans | 53.6 /100 | #168 | Average 16.3% |
| Northern Europeans | 52.8 /100 | #169 | Average 16.3% |
| Scandinavians | 52.3 /100 | #170 | Average 16.3% |
| Immigrants | Morocco | 50.7 /100 | #171 | Average 16.3% |