Immigrants from Switzerland vs Pennsylvania German Single Father Poverty
COMPARE
Immigrants from Switzerland
Pennsylvania German
Single Father Poverty
Single Father Poverty Comparison
Immigrants from Switzerland
Pennsylvania Germans
16.5%
SINGLE FATHER POVERTY
24.8/ 100
METRIC RATING
192nd/ 347
METRIC RANK
20.0%
SINGLE FATHER POVERTY
0.0/ 100
METRIC RATING
323rd/ 347
METRIC RANK
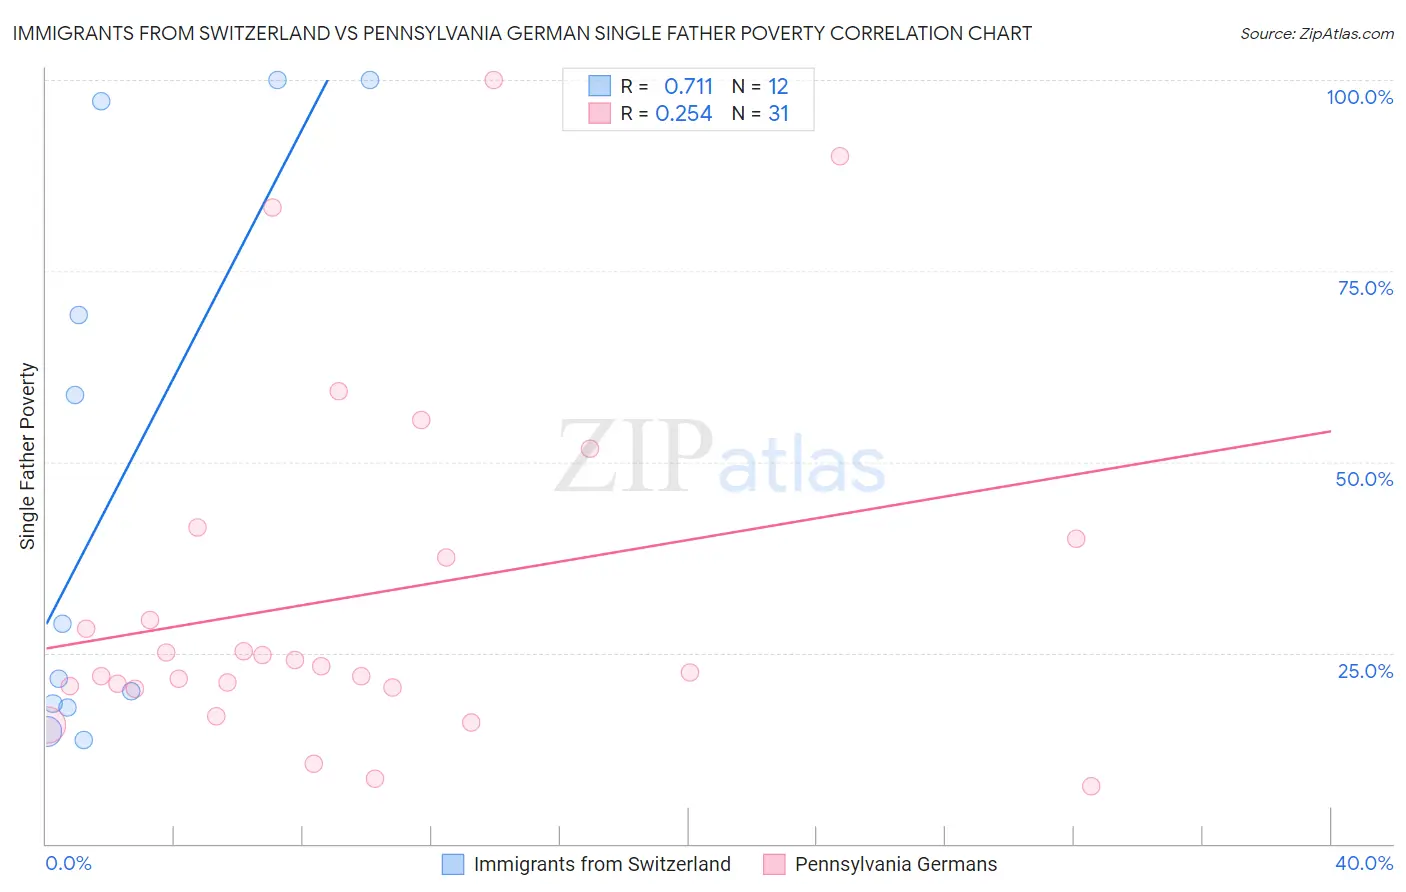
Immigrants from Switzerland vs Pennsylvania German Single Father Poverty Correlation Chart
The statistical analysis conducted on geographies consisting of 124,581,780 people shows a strong positive correlation between the proportion of Immigrants from Switzerland and poverty level among single fathers in the United States with a correlation coefficient (R) of 0.711 and weighted average of 16.5%. Similarly, the statistical analysis conducted on geographies consisting of 194,261,919 people shows a weak positive correlation between the proportion of Pennsylvania Germans and poverty level among single fathers in the United States with a correlation coefficient (R) of 0.254 and weighted average of 20.0%, a difference of 21.3%.
Single Father Poverty Correlation Summary
| Measurement | Immigrants from Switzerland | Pennsylvania German |
| Minimum | 13.7% | 7.5% |
| Maximum | 100.0% | 100.0% |
| Range | 86.3% | 92.5% |
| Mean | 46.7% | 32.4% |
| Median | 25.2% | 23.2% |
| Interquartile 25% (IQ1) | 18.1% | 20.4% |
| Interquartile 75% (IQ3) | 83.2% | 40.0% |
| Interquartile Range (IQR) | 65.1% | 19.6% |
| Standard Deviation (Sample) | 36.1% | 23.3% |
| Standard Deviation (Population) | 34.5% | 22.9% |
Similar Demographics by Single Father Poverty
Demographics Similar to Immigrants from Switzerland by Single Father Poverty
In terms of single father poverty, the demographic groups most similar to Immigrants from Switzerland are Ecuadorian (16.5%, a difference of 0.010%), Cape Verdean (16.5%, a difference of 0.020%), Immigrants from Barbados (16.5%, a difference of 0.030%), Immigrants from Guyana (16.5%, a difference of 0.13%), and Immigrants from Canada (16.5%, a difference of 0.17%).
| Demographics | Rating | Rank | Single Father Poverty |
| Panamanians | 33.6 /100 | #185 | Fair 16.4% |
| Immigrants | Venezuela | 31.0 /100 | #186 | Fair 16.4% |
| Ukrainians | 30.4 /100 | #187 | Fair 16.4% |
| Russians | 30.1 /100 | #188 | Fair 16.4% |
| Latvians | 28.9 /100 | #189 | Fair 16.5% |
| Immigrants | Burma/Myanmar | 28.0 /100 | #190 | Fair 16.5% |
| Immigrants | Guyana | 27.1 /100 | #191 | Fair 16.5% |
| Immigrants | Switzerland | 24.8 /100 | #192 | Fair 16.5% |
| Ecuadorians | 24.5 /100 | #193 | Fair 16.5% |
| Cape Verdeans | 24.4 /100 | #194 | Fair 16.5% |
| Immigrants | Barbados | 24.3 /100 | #195 | Fair 16.5% |
| Immigrants | Canada | 21.9 /100 | #196 | Fair 16.5% |
| Immigrants | Northern Europe | 20.3 /100 | #197 | Fair 16.5% |
| Romanians | 20.1 /100 | #198 | Fair 16.5% |
| Immigrants | Belize | 19.8 /100 | #199 | Poor 16.5% |
Demographics Similar to Pennsylvania Germans by Single Father Poverty
In terms of single father poverty, the demographic groups most similar to Pennsylvania Germans are American (20.1%, a difference of 0.22%), Creek (19.8%, a difference of 0.90%), Black/African American (20.4%, a difference of 1.8%), Cherokee (19.6%, a difference of 1.9%), and Inupiat (19.5%, a difference of 2.8%).
| Demographics | Rating | Rank | Single Father Poverty |
| Osage | 0.0 /100 | #316 | Tragic 19.0% |
| Dominicans | 0.0 /100 | #317 | Tragic 19.1% |
| Dutch West Indians | 0.0 /100 | #318 | Tragic 19.2% |
| Slovaks | 0.0 /100 | #319 | Tragic 19.3% |
| Inupiat | 0.0 /100 | #320 | Tragic 19.5% |
| Cherokee | 0.0 /100 | #321 | Tragic 19.6% |
| Creek | 0.0 /100 | #322 | Tragic 19.8% |
| Pennsylvania Germans | 0.0 /100 | #323 | Tragic 20.0% |
| Americans | 0.0 /100 | #324 | Tragic 20.1% |
| Blacks/African Americans | 0.0 /100 | #325 | Tragic 20.4% |
| Immigrants | Yemen | 0.0 /100 | #326 | Tragic 20.6% |
| Choctaw | 0.0 /100 | #327 | Tragic 20.7% |
| Pueblo | 0.0 /100 | #328 | Tragic 21.1% |
| Colville | 0.0 /100 | #329 | Tragic 21.4% |
| Paiute | 0.0 /100 | #330 | Tragic 21.6% |