Immigrants from Brazil vs Pennsylvania German Single Father Poverty
COMPARE
Immigrants from Brazil
Pennsylvania German
Single Father Poverty
Single Father Poverty Comparison
Immigrants from Brazil
Pennsylvania Germans
15.3%
SINGLE FATHER POVERTY
99.6/ 100
METRIC RATING
71st/ 347
METRIC RANK
20.0%
SINGLE FATHER POVERTY
0.0/ 100
METRIC RATING
323rd/ 347
METRIC RANK
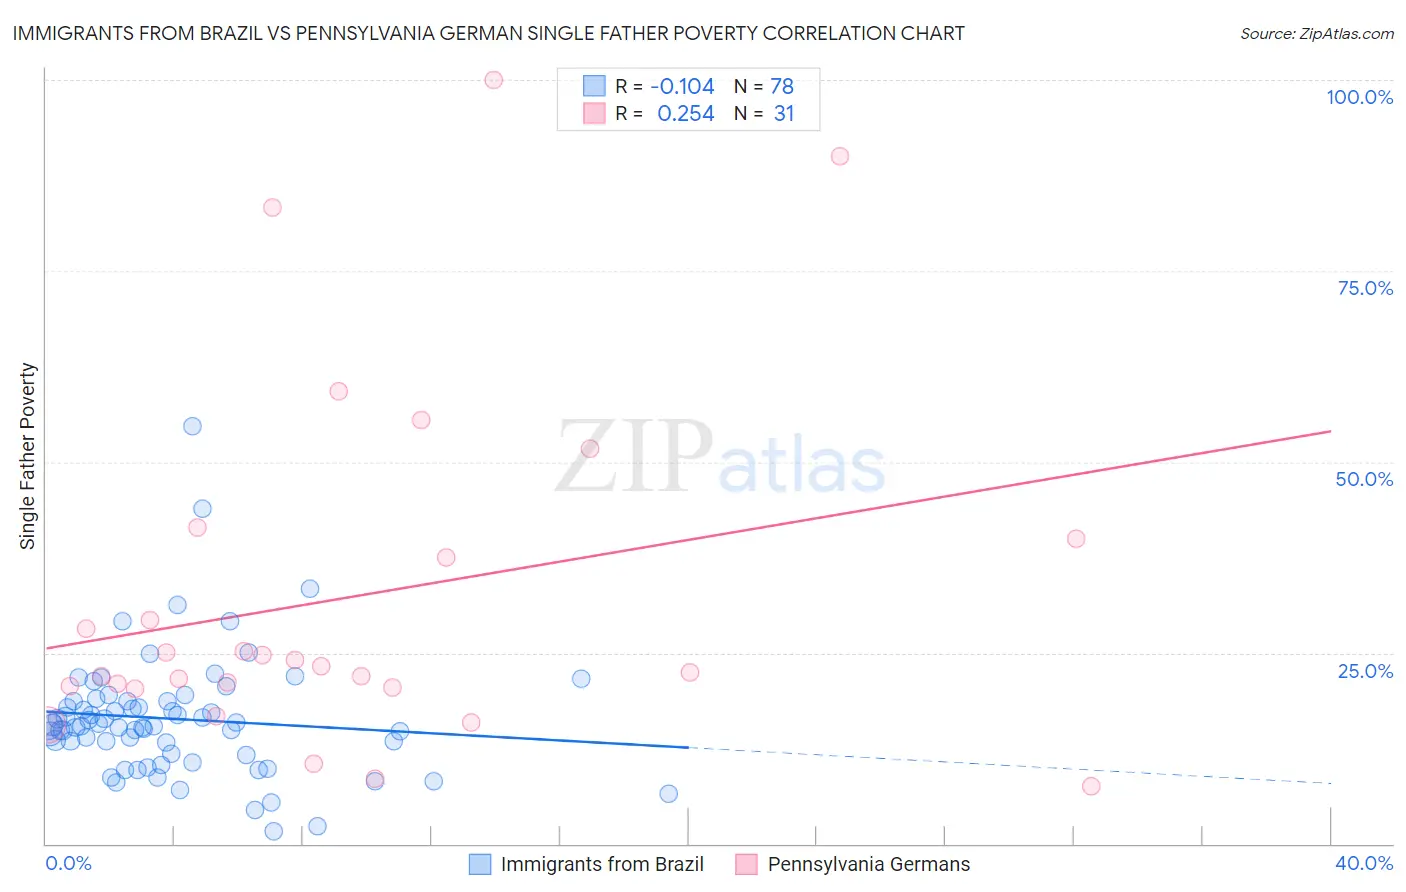
Immigrants from Brazil vs Pennsylvania German Single Father Poverty Correlation Chart
The statistical analysis conducted on geographies consisting of 271,222,328 people shows a poor negative correlation between the proportion of Immigrants from Brazil and poverty level among single fathers in the United States with a correlation coefficient (R) of -0.104 and weighted average of 15.3%. Similarly, the statistical analysis conducted on geographies consisting of 194,261,919 people shows a weak positive correlation between the proportion of Pennsylvania Germans and poverty level among single fathers in the United States with a correlation coefficient (R) of 0.254 and weighted average of 20.0%, a difference of 31.0%.
Single Father Poverty Correlation Summary
| Measurement | Immigrants from Brazil | Pennsylvania German |
| Minimum | 1.7% | 7.5% |
| Maximum | 54.6% | 100.0% |
| Range | 53.0% | 92.5% |
| Mean | 16.3% | 32.4% |
| Median | 15.5% | 23.2% |
| Interquartile 25% (IQ1) | 11.8% | 20.4% |
| Interquartile 75% (IQ3) | 18.6% | 40.0% |
| Interquartile Range (IQR) | 6.8% | 19.6% |
| Standard Deviation (Sample) | 8.1% | 23.3% |
| Standard Deviation (Population) | 8.0% | 22.9% |
Similar Demographics by Single Father Poverty
Demographics Similar to Immigrants from Brazil by Single Father Poverty
In terms of single father poverty, the demographic groups most similar to Immigrants from Brazil are Immigrants from Lithuania (15.3%, a difference of 0.12%), Mongolian (15.3%, a difference of 0.21%), Kenyan (15.3%, a difference of 0.21%), Maltese (15.3%, a difference of 0.25%), and Immigrants from Turkey (15.3%, a difference of 0.27%).
| Demographics | Rating | Rank | Single Father Poverty |
| Bangladeshis | 99.8 /100 | #64 | Exceptional 15.2% |
| Immigrants | Malaysia | 99.8 /100 | #65 | Exceptional 15.2% |
| Immigrants | Moldova | 99.8 /100 | #66 | Exceptional 15.2% |
| Paraguayans | 99.7 /100 | #67 | Exceptional 15.2% |
| Immigrants | Cameroon | 99.7 /100 | #68 | Exceptional 15.2% |
| Japanese | 99.7 /100 | #69 | Exceptional 15.2% |
| Mongolians | 99.7 /100 | #70 | Exceptional 15.3% |
| Immigrants | Brazil | 99.6 /100 | #71 | Exceptional 15.3% |
| Immigrants | Lithuania | 99.6 /100 | #72 | Exceptional 15.3% |
| Kenyans | 99.6 /100 | #73 | Exceptional 15.3% |
| Maltese | 99.6 /100 | #74 | Exceptional 15.3% |
| Immigrants | Turkey | 99.5 /100 | #75 | Exceptional 15.3% |
| Immigrants | Japan | 99.5 /100 | #76 | Exceptional 15.3% |
| Immigrants | Peru | 99.5 /100 | #77 | Exceptional 15.3% |
| Tlingit-Haida | 99.5 /100 | #78 | Exceptional 15.3% |
Demographics Similar to Pennsylvania Germans by Single Father Poverty
In terms of single father poverty, the demographic groups most similar to Pennsylvania Germans are American (20.1%, a difference of 0.22%), Creek (19.8%, a difference of 0.90%), Black/African American (20.4%, a difference of 1.8%), Cherokee (19.6%, a difference of 1.9%), and Inupiat (19.5%, a difference of 2.8%).
| Demographics | Rating | Rank | Single Father Poverty |
| Osage | 0.0 /100 | #316 | Tragic 19.0% |
| Dominicans | 0.0 /100 | #317 | Tragic 19.1% |
| Dutch West Indians | 0.0 /100 | #318 | Tragic 19.2% |
| Slovaks | 0.0 /100 | #319 | Tragic 19.3% |
| Inupiat | 0.0 /100 | #320 | Tragic 19.5% |
| Cherokee | 0.0 /100 | #321 | Tragic 19.6% |
| Creek | 0.0 /100 | #322 | Tragic 19.8% |
| Pennsylvania Germans | 0.0 /100 | #323 | Tragic 20.0% |
| Americans | 0.0 /100 | #324 | Tragic 20.1% |
| Blacks/African Americans | 0.0 /100 | #325 | Tragic 20.4% |
| Immigrants | Yemen | 0.0 /100 | #326 | Tragic 20.6% |
| Choctaw | 0.0 /100 | #327 | Tragic 20.7% |
| Pueblo | 0.0 /100 | #328 | Tragic 21.1% |
| Colville | 0.0 /100 | #329 | Tragic 21.4% |
| Paiute | 0.0 /100 | #330 | Tragic 21.6% |