Immigrants from Morocco vs Pennsylvania German Single Father Poverty
COMPARE
Immigrants from Morocco
Pennsylvania German
Single Father Poverty
Single Father Poverty Comparison
Immigrants from Morocco
Pennsylvania Germans
16.3%
SINGLE FATHER POVERTY
50.7/ 100
METRIC RATING
171st/ 347
METRIC RANK
20.0%
SINGLE FATHER POVERTY
0.0/ 100
METRIC RATING
323rd/ 347
METRIC RANK
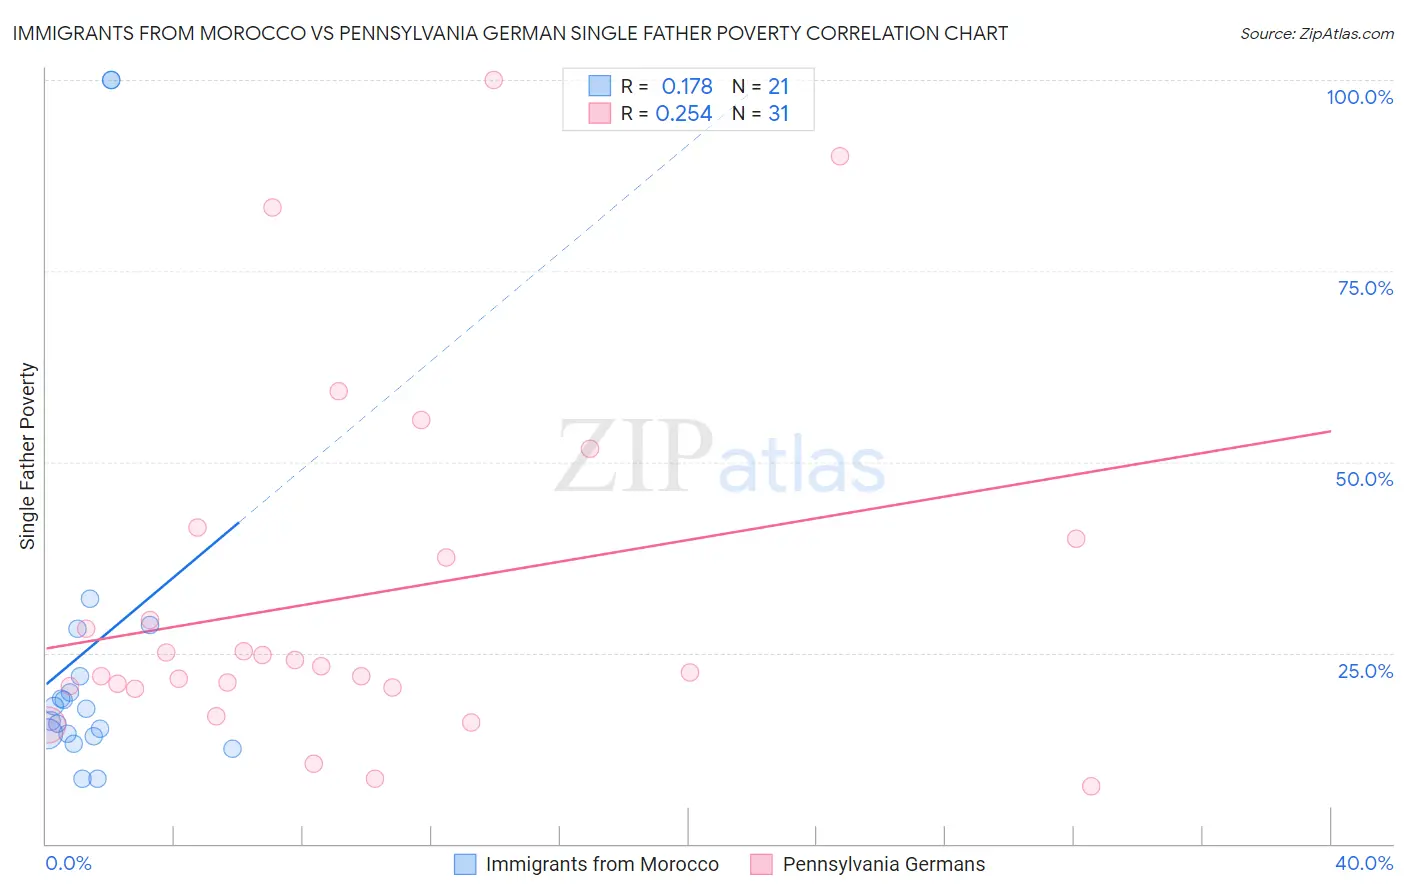
Immigrants from Morocco vs Pennsylvania German Single Father Poverty Correlation Chart
The statistical analysis conducted on geographies consisting of 153,611,026 people shows a poor positive correlation between the proportion of Immigrants from Morocco and poverty level among single fathers in the United States with a correlation coefficient (R) of 0.178 and weighted average of 16.3%. Similarly, the statistical analysis conducted on geographies consisting of 194,261,919 people shows a weak positive correlation between the proportion of Pennsylvania Germans and poverty level among single fathers in the United States with a correlation coefficient (R) of 0.254 and weighted average of 20.0%, a difference of 22.9%.
Single Father Poverty Correlation Summary
| Measurement | Immigrants from Morocco | Pennsylvania German |
| Minimum | 8.5% | 7.5% |
| Maximum | 100.0% | 100.0% |
| Range | 91.5% | 92.5% |
| Mean | 25.5% | 32.4% |
| Median | 17.7% | 23.2% |
| Interquartile 25% (IQ1) | 14.2% | 20.4% |
| Interquartile 75% (IQ3) | 25.0% | 40.0% |
| Interquartile Range (IQR) | 10.8% | 19.6% |
| Standard Deviation (Sample) | 25.5% | 23.3% |
| Standard Deviation (Population) | 24.9% | 22.9% |
Similar Demographics by Single Father Poverty
Demographics Similar to Immigrants from Morocco by Single Father Poverty
In terms of single father poverty, the demographic groups most similar to Immigrants from Morocco are Immigrants from Sierra Leone (16.3%, a difference of 0.030%), Immigrants from St. Vincent and the Grenadines (16.3%, a difference of 0.030%), Swedish (16.3%, a difference of 0.030%), Immigrants from Ecuador (16.3%, a difference of 0.050%), and Scandinavian (16.3%, a difference of 0.070%).
| Demographics | Rating | Rank | Single Father Poverty |
| Guyanese | 55.2 /100 | #164 | Average 16.3% |
| Immigrants | Bangladesh | 55.1 /100 | #165 | Average 16.3% |
| Immigrants | Europe | 54.8 /100 | #166 | Average 16.3% |
| Yugoslavians | 53.9 /100 | #167 | Average 16.3% |
| Costa Ricans | 53.6 /100 | #168 | Average 16.3% |
| Northern Europeans | 52.8 /100 | #169 | Average 16.3% |
| Scandinavians | 52.3 /100 | #170 | Average 16.3% |
| Immigrants | Morocco | 50.7 /100 | #171 | Average 16.3% |
| Immigrants | Sierra Leone | 50.1 /100 | #172 | Average 16.3% |
| Immigrants | St. Vincent and the Grenadines | 50.0 /100 | #173 | Average 16.3% |
| Swedes | 50.0 /100 | #174 | Average 16.3% |
| Immigrants | Ecuador | 49.7 /100 | #175 | Average 16.3% |
| Vietnamese | 48.0 /100 | #176 | Average 16.3% |
| Immigrants | South Africa | 44.2 /100 | #177 | Average 16.3% |
| Immigrants | Cuba | 41.6 /100 | #178 | Average 16.4% |
Demographics Similar to Pennsylvania Germans by Single Father Poverty
In terms of single father poverty, the demographic groups most similar to Pennsylvania Germans are American (20.1%, a difference of 0.22%), Creek (19.8%, a difference of 0.90%), Black/African American (20.4%, a difference of 1.8%), Cherokee (19.6%, a difference of 1.9%), and Inupiat (19.5%, a difference of 2.8%).
| Demographics | Rating | Rank | Single Father Poverty |
| Osage | 0.0 /100 | #316 | Tragic 19.0% |
| Dominicans | 0.0 /100 | #317 | Tragic 19.1% |
| Dutch West Indians | 0.0 /100 | #318 | Tragic 19.2% |
| Slovaks | 0.0 /100 | #319 | Tragic 19.3% |
| Inupiat | 0.0 /100 | #320 | Tragic 19.5% |
| Cherokee | 0.0 /100 | #321 | Tragic 19.6% |
| Creek | 0.0 /100 | #322 | Tragic 19.8% |
| Pennsylvania Germans | 0.0 /100 | #323 | Tragic 20.0% |
| Americans | 0.0 /100 | #324 | Tragic 20.1% |
| Blacks/African Americans | 0.0 /100 | #325 | Tragic 20.4% |
| Immigrants | Yemen | 0.0 /100 | #326 | Tragic 20.6% |
| Choctaw | 0.0 /100 | #327 | Tragic 20.7% |
| Pueblo | 0.0 /100 | #328 | Tragic 21.1% |
| Colville | 0.0 /100 | #329 | Tragic 21.4% |
| Paiute | 0.0 /100 | #330 | Tragic 21.6% |