Tohono O'odham vs Osage Female Disability
COMPARE
Tohono O'odham
Osage
Female Disability
Female Disability Comparison
Tohono O'odham
Osage
15.0%
FEMALE DISABILITY
0.0/ 100
METRIC RATING
337th/ 347
METRIC RANK
14.3%
FEMALE DISABILITY
0.0/ 100
METRIC RATING
329th/ 347
METRIC RANK
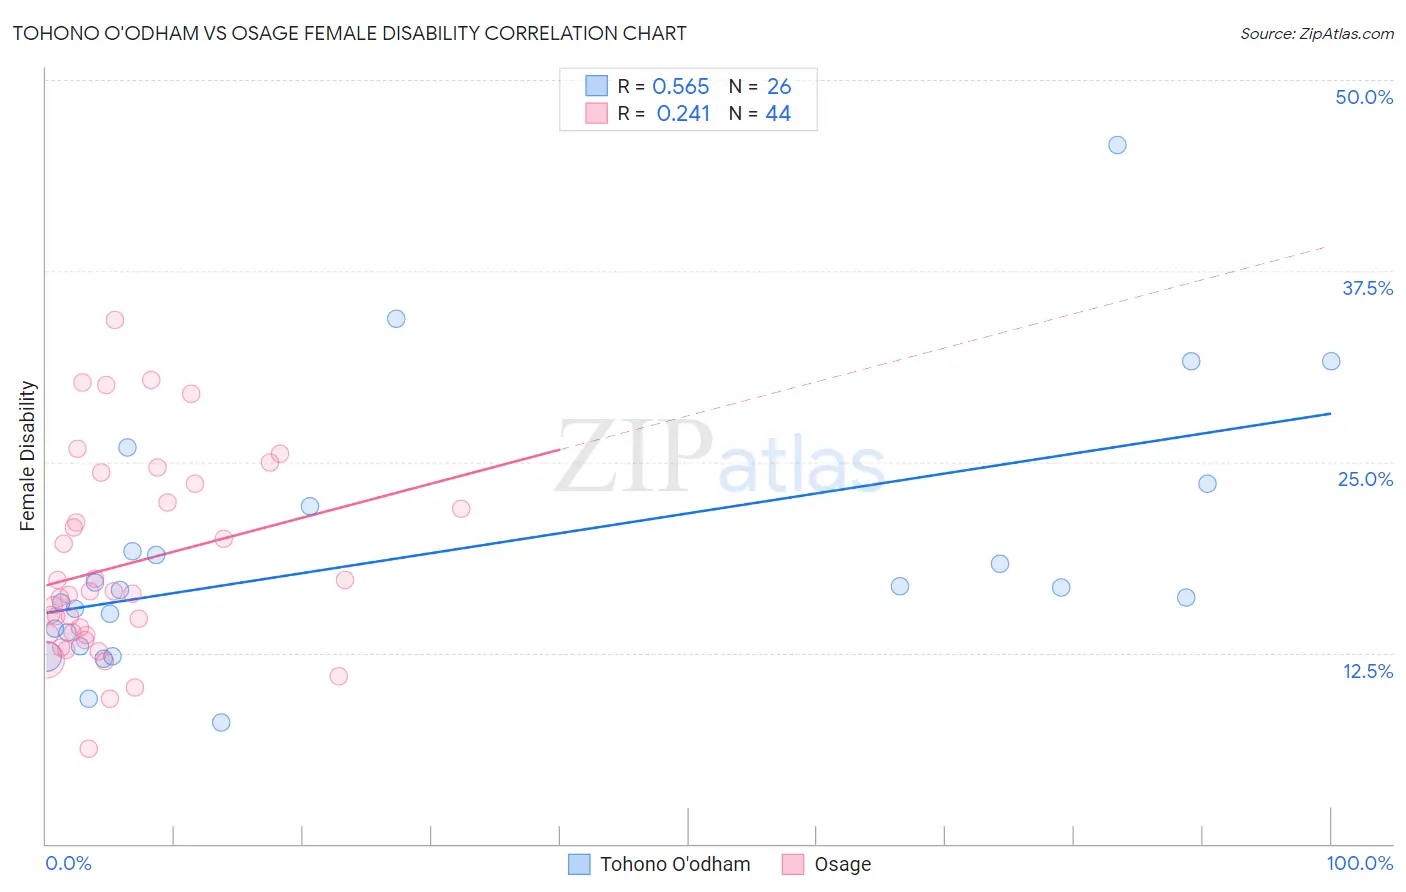
Tohono O'odham vs Osage Female Disability Correlation Chart
The statistical analysis conducted on geographies consisting of 58,717,428 people shows a substantial positive correlation between the proportion of Tohono O'odham and percentage of females with a disability in the United States with a correlation coefficient (R) of 0.565 and weighted average of 15.0%. Similarly, the statistical analysis conducted on geographies consisting of 91,799,541 people shows a weak positive correlation between the proportion of Osage and percentage of females with a disability in the United States with a correlation coefficient (R) of 0.241 and weighted average of 14.3%, a difference of 4.8%.
Female Disability Correlation Summary
| Measurement | Tohono O'odham | Osage |
| Minimum | 8.0% | 6.2% |
| Maximum | 45.8% | 34.3% |
| Range | 37.8% | 28.1% |
| Mean | 19.1% | 18.3% |
| Median | 16.7% | 16.4% |
| Interquartile 25% (IQ1) | 13.9% | 13.7% |
| Interquartile 75% (IQ3) | 22.1% | 22.9% |
| Interquartile Range (IQR) | 8.3% | 9.2% |
| Standard Deviation (Sample) | 8.6% | 6.5% |
| Standard Deviation (Population) | 8.4% | 6.4% |
Demographics Similar to Tohono O'odham and Osage by Female Disability
In terms of female disability, the demographic groups most similar to Tohono O'odham are Seminole (15.0%, a difference of 0.12%), Dutch West Indian (15.0%, a difference of 0.14%), Colville (15.1%, a difference of 0.55%), Cajun (14.9%, a difference of 0.80%), and Cherokee (14.9%, a difference of 0.82%). Similarly, the demographic groups most similar to Osage are Ottawa (14.2%, a difference of 0.43%), Cape Verdean (14.2%, a difference of 0.43%), Comanche (14.2%, a difference of 0.87%), Navajo (14.2%, a difference of 0.98%), and Native/Alaskan (14.1%, a difference of 1.1%).
| Demographics | Rating | Rank | Female Disability |
| Blacks/African Americans | 0.0 /100 | #323 | Tragic 14.1% |
| Natives/Alaskans | 0.0 /100 | #324 | Tragic 14.1% |
| Navajo | 0.0 /100 | #325 | Tragic 14.2% |
| Comanche | 0.0 /100 | #326 | Tragic 14.2% |
| Ottawa | 0.0 /100 | #327 | Tragic 14.2% |
| Cape Verdeans | 0.0 /100 | #328 | Tragic 14.2% |
| Osage | 0.0 /100 | #329 | Tragic 14.3% |
| Yuman | 0.0 /100 | #330 | Tragic 14.5% |
| Immigrants | Cabo Verde | 0.0 /100 | #331 | Tragic 14.6% |
| Pima | 0.0 /100 | #332 | Tragic 14.8% |
| Immigrants | Azores | 0.0 /100 | #333 | Tragic 14.9% |
| Cherokee | 0.0 /100 | #334 | Tragic 14.9% |
| Cajuns | 0.0 /100 | #335 | Tragic 14.9% |
| Seminole | 0.0 /100 | #336 | Tragic 15.0% |
| Tohono O'odham | 0.0 /100 | #337 | Tragic 15.0% |
| Dutch West Indians | 0.0 /100 | #338 | Tragic 15.0% |
| Colville | 0.0 /100 | #339 | Tragic 15.1% |
| Chickasaw | 0.0 /100 | #340 | Tragic 15.2% |
| Choctaw | 0.0 /100 | #341 | Tragic 15.4% |
| Creek | 0.0 /100 | #342 | Tragic 15.7% |
| Lumbee | 0.0 /100 | #343 | Tragic 15.8% |