Tohono O'odham vs Dominican Single Male Poverty
COMPARE
Tohono O'odham
Dominican
Single Male Poverty
Single Male Poverty Comparison
Tohono O'odham
Dominicans
21.6%
SINGLE MALE POVERTY
0.0/ 100
METRIC RATING
336th/ 347
METRIC RANK
15.2%
SINGLE MALE POVERTY
0.0/ 100
METRIC RATING
301st/ 347
METRIC RANK
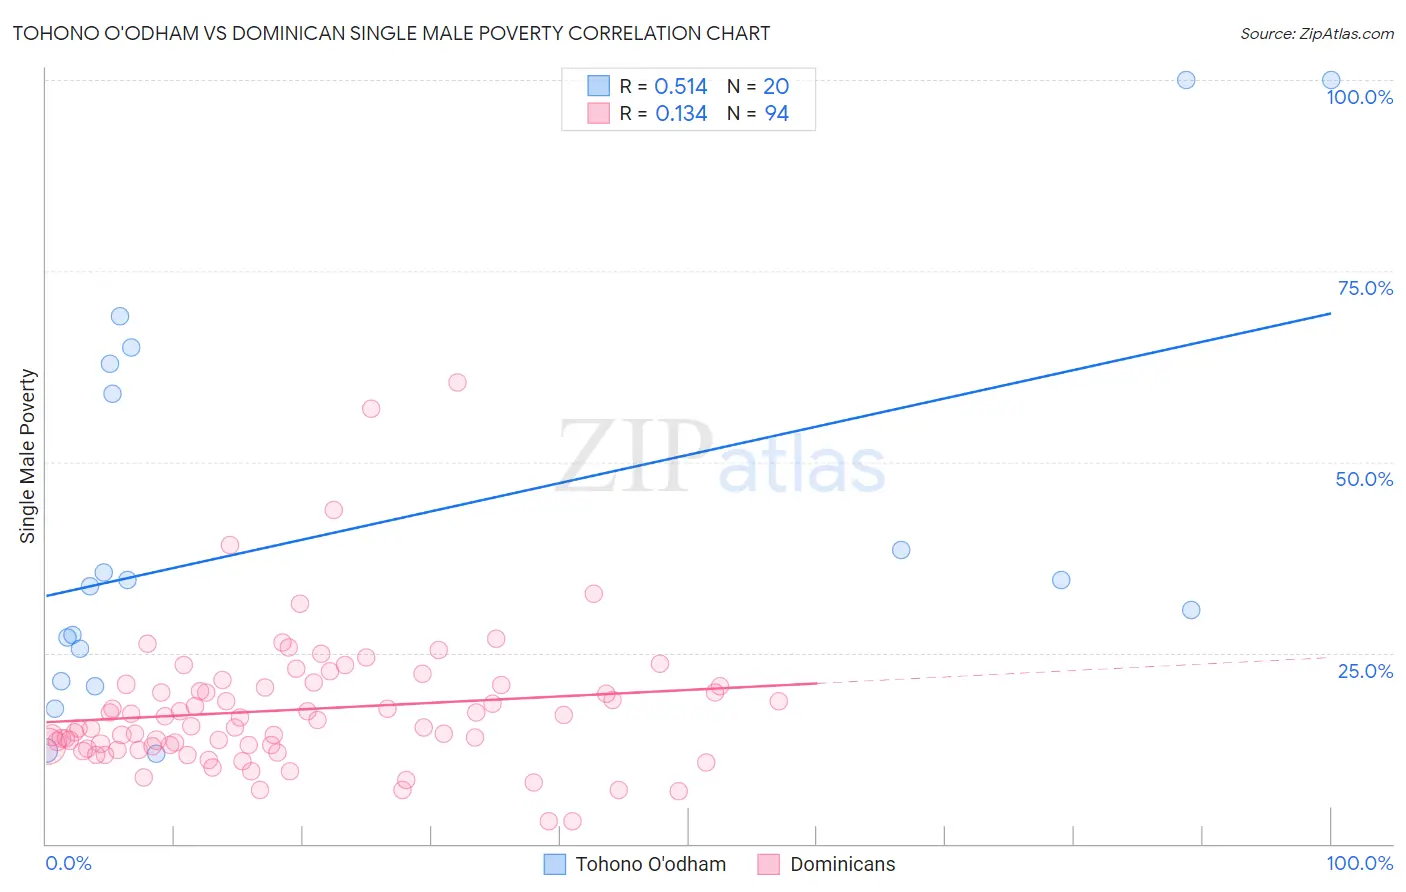
Tohono O'odham vs Dominican Single Male Poverty Correlation Chart
The statistical analysis conducted on geographies consisting of 57,748,235 people shows a substantial positive correlation between the proportion of Tohono O'odham and poverty level among single males in the United States with a correlation coefficient (R) of 0.514 and weighted average of 21.6%. Similarly, the statistical analysis conducted on geographies consisting of 318,233,165 people shows a poor positive correlation between the proportion of Dominicans and poverty level among single males in the United States with a correlation coefficient (R) of 0.134 and weighted average of 15.2%, a difference of 41.6%.
Single Male Poverty Correlation Summary
| Measurement | Tohono O'odham | Dominican |
| Minimum | 11.9% | 2.9% |
| Maximum | 100.0% | 60.5% |
| Range | 88.1% | 57.6% |
| Mean | 41.3% | 17.6% |
| Median | 34.1% | 15.4% |
| Interquartile 25% (IQ1) | 23.4% | 12.8% |
| Interquartile 75% (IQ3) | 60.9% | 20.6% |
| Interquartile Range (IQR) | 37.5% | 7.8% |
| Standard Deviation (Sample) | 26.2% | 9.1% |
| Standard Deviation (Population) | 25.6% | 9.1% |
Similar Demographics by Single Male Poverty
Demographics Similar to Tohono O'odham by Single Male Poverty
In terms of single male poverty, the demographic groups most similar to Tohono O'odham are Apache (21.6%, a difference of 0.10%), Pueblo (21.6%, a difference of 0.28%), Yuman (21.3%, a difference of 1.2%), Arapaho (21.9%, a difference of 1.8%), and Sioux (22.2%, a difference of 3.1%).
| Demographics | Rating | Rank | Single Male Poverty |
| Colville | 0.0 /100 | #329 | Tragic 18.4% |
| Cajuns | 0.0 /100 | #330 | Tragic 19.1% |
| Paiute | 0.0 /100 | #331 | Tragic 19.3% |
| Natives/Alaskans | 0.0 /100 | #332 | Tragic 19.6% |
| Inupiat | 0.0 /100 | #333 | Tragic 20.0% |
| Pima | 0.0 /100 | #334 | Tragic 20.2% |
| Yuman | 0.0 /100 | #335 | Tragic 21.3% |
| Tohono O'odham | 0.0 /100 | #336 | Tragic 21.6% |
| Apache | 0.0 /100 | #337 | Tragic 21.6% |
| Pueblo | 0.0 /100 | #338 | Tragic 21.6% |
| Arapaho | 0.0 /100 | #339 | Tragic 21.9% |
| Sioux | 0.0 /100 | #340 | Tragic 22.2% |
| Crow | 0.0 /100 | #341 | Tragic 23.3% |
| Houma | 0.0 /100 | #342 | Tragic 23.5% |
| Puerto Ricans | 0.0 /100 | #343 | Tragic 25.1% |
Demographics Similar to Dominicans by Single Male Poverty
In terms of single male poverty, the demographic groups most similar to Dominicans are Alsatian (15.2%, a difference of 0.16%), Cree (15.1%, a difference of 0.82%), Aleut (15.4%, a difference of 1.2%), Delaware (15.0%, a difference of 1.3%), and Alaska Native (15.4%, a difference of 1.3%).
| Demographics | Rating | Rank | Single Male Poverty |
| Ottawa | 0.0 /100 | #294 | Tragic 14.6% |
| Scotch-Irish | 0.0 /100 | #295 | Tragic 14.7% |
| Africans | 0.0 /100 | #296 | Tragic 14.7% |
| Immigrants | Dominican Republic | 0.0 /100 | #297 | Tragic 14.8% |
| French American Indians | 0.0 /100 | #298 | Tragic 15.0% |
| Delaware | 0.0 /100 | #299 | Tragic 15.0% |
| Cree | 0.0 /100 | #300 | Tragic 15.1% |
| Dominicans | 0.0 /100 | #301 | Tragic 15.2% |
| Alsatians | 0.0 /100 | #302 | Tragic 15.2% |
| Aleuts | 0.0 /100 | #303 | Tragic 15.4% |
| Alaska Natives | 0.0 /100 | #304 | Tragic 15.4% |
| Blackfeet | 0.0 /100 | #305 | Tragic 15.5% |
| Pennsylvania Germans | 0.0 /100 | #306 | Tragic 15.6% |
| Ute | 0.0 /100 | #307 | Tragic 15.7% |
| Potawatomi | 0.0 /100 | #308 | Tragic 15.8% |