Tlingit-Haida vs Immigrants from Germany Single Father Households
COMPARE
Tlingit-Haida
Immigrants from Germany
Single Father Households
Single Father Households Comparison
Tlingit-Haida
Immigrants from Germany
2.7%
SINGLE FATHER HOUSEHOLDS
0.0/ 100
METRIC RATING
289th/ 347
METRIC RANK
2.3%
SINGLE FATHER HOUSEHOLDS
82.8/ 100
METRIC RATING
153rd/ 347
METRIC RANK
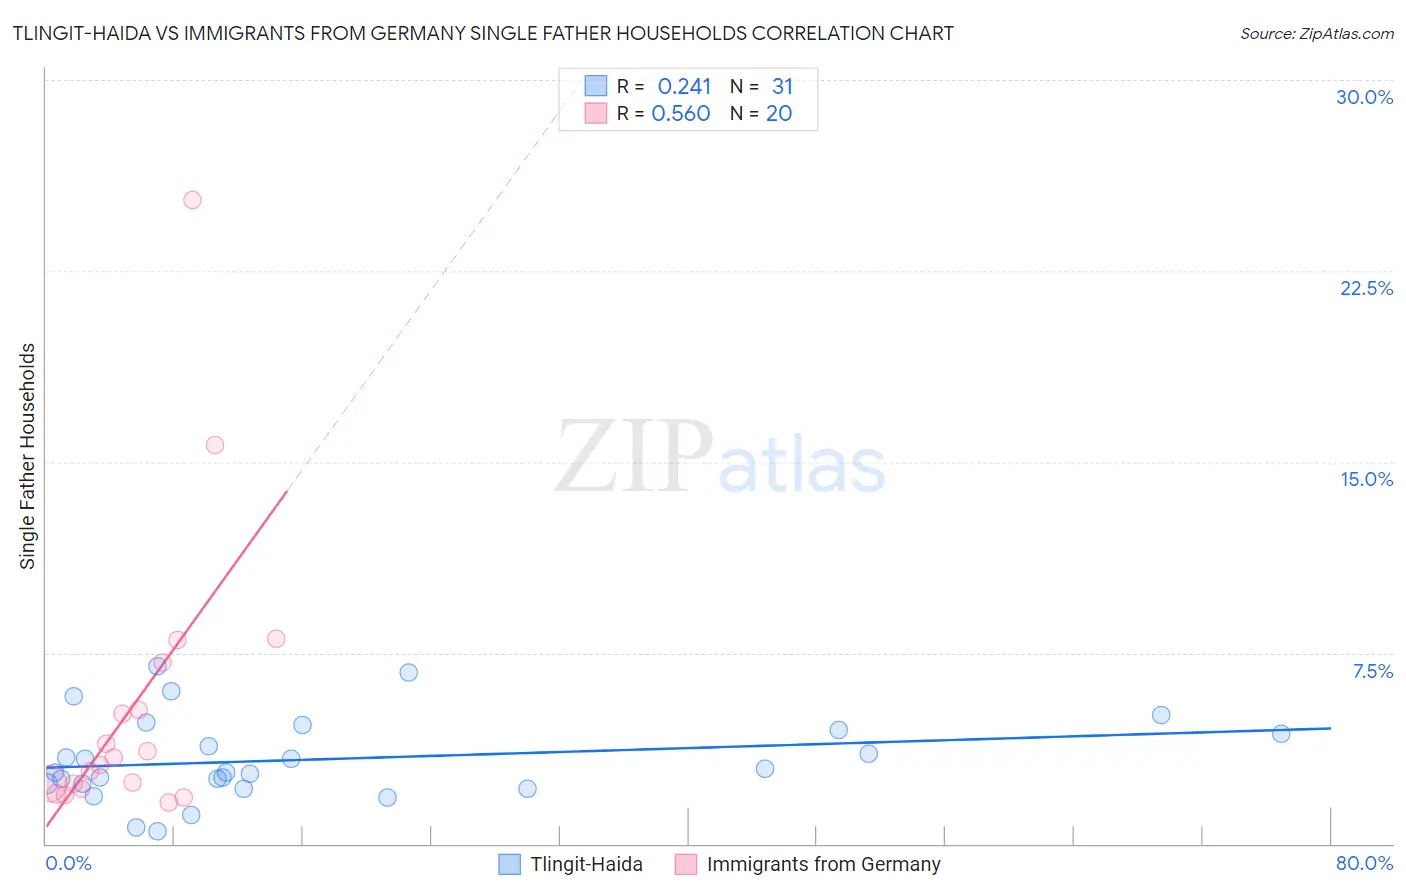
Tlingit-Haida vs Immigrants from Germany Single Father Households Correlation Chart
The statistical analysis conducted on geographies consisting of 60,729,668 people shows a weak positive correlation between the proportion of Tlingit-Haida and percentage of single father households in the United States with a correlation coefficient (R) of 0.241 and weighted average of 2.7%. Similarly, the statistical analysis conducted on geographies consisting of 458,347,469 people shows a substantial positive correlation between the proportion of Immigrants from Germany and percentage of single father households in the United States with a correlation coefficient (R) of 0.560 and weighted average of 2.3%, a difference of 17.8%.
Single Father Households Correlation Summary
| Measurement | Tlingit-Haida | Immigrants from Germany |
| Minimum | 0.49% | 1.6% |
| Maximum | 6.9% | 25.3% |
| Range | 6.5% | 23.6% |
| Mean | 3.3% | 5.4% |
| Median | 2.8% | 3.2% |
| Interquartile 25% (IQ1) | 2.4% | 2.3% |
| Interquartile 75% (IQ3) | 4.5% | 6.2% |
| Interquartile Range (IQR) | 2.1% | 3.9% |
| Standard Deviation (Sample) | 1.6% | 5.7% |
| Standard Deviation (Population) | 1.6% | 5.6% |
Similar Demographics by Single Father Households
Demographics Similar to Tlingit-Haida by Single Father Households
In terms of single father households, the demographic groups most similar to Tlingit-Haida are Immigrants from Cambodia (2.7%, a difference of 0.060%), Central American Indian (2.7%, a difference of 0.31%), Puget Sound Salish (2.7%, a difference of 0.45%), Ottawa (2.7%, a difference of 0.47%), and Immigrants from Cuba (2.7%, a difference of 0.47%).
| Demographics | Rating | Rank | Single Father Households |
| Dutch West Indians | 0.1 /100 | #282 | Tragic 2.6% |
| Immigrants | Nicaragua | 0.1 /100 | #283 | Tragic 2.7% |
| Hawaiians | 0.1 /100 | #284 | Tragic 2.7% |
| Ottawa | 0.1 /100 | #285 | Tragic 2.7% |
| Immigrants | Cuba | 0.1 /100 | #286 | Tragic 2.7% |
| Central American Indians | 0.0 /100 | #287 | Tragic 2.7% |
| Immigrants | Cambodia | 0.0 /100 | #288 | Tragic 2.7% |
| Tlingit-Haida | 0.0 /100 | #289 | Tragic 2.7% |
| Puget Sound Salish | 0.0 /100 | #290 | Tragic 2.7% |
| Blackfeet | 0.0 /100 | #291 | Tragic 2.7% |
| Choctaw | 0.0 /100 | #292 | Tragic 2.7% |
| Immigrants | Fiji | 0.0 /100 | #293 | Tragic 2.7% |
| Malaysians | 0.0 /100 | #294 | Tragic 2.7% |
| Chickasaw | 0.0 /100 | #295 | Tragic 2.8% |
| Japanese | 0.0 /100 | #296 | Tragic 2.8% |
Demographics Similar to Immigrants from Germany by Single Father Households
In terms of single father households, the demographic groups most similar to Immigrants from Germany are Immigrants from Venezuela (2.3%, a difference of 0.050%), Bolivian (2.3%, a difference of 0.22%), European (2.3%, a difference of 0.24%), Immigrants from Syria (2.3%, a difference of 0.28%), and Immigrants from South America (2.3%, a difference of 0.36%).
| Demographics | Rating | Rank | Single Father Households |
| Northern Europeans | 89.8 /100 | #146 | Excellent 2.2% |
| Slavs | 88.9 /100 | #147 | Excellent 2.2% |
| South American Indians | 88.5 /100 | #148 | Excellent 2.3% |
| Senegalese | 88.4 /100 | #149 | Excellent 2.3% |
| Venezuelans | 86.2 /100 | #150 | Excellent 2.3% |
| Immigrants | Syria | 84.8 /100 | #151 | Excellent 2.3% |
| Immigrants | Venezuela | 83.2 /100 | #152 | Excellent 2.3% |
| Immigrants | Germany | 82.8 /100 | #153 | Excellent 2.3% |
| Bolivians | 81.0 /100 | #154 | Excellent 2.3% |
| Europeans | 80.9 /100 | #155 | Excellent 2.3% |
| Immigrants | South America | 79.9 /100 | #156 | Good 2.3% |
| Canadians | 79.7 /100 | #157 | Good 2.3% |
| Immigrants | Senegal | 79.4 /100 | #158 | Good 2.3% |
| Immigrants | West Indies | 77.9 /100 | #159 | Good 2.3% |
| Immigrants | Bolivia | 76.3 /100 | #160 | Good 2.3% |