Tlingit-Haida vs British Unemployment Among Ages 30 to 34 years
COMPARE
Tlingit-Haida
British
Unemployment Among Ages 30 to 34 years
Unemployment Among Ages 30 to 34 years Comparison
Tlingit-Haida
British
6.0%
UNEMPLOYMENT AMONG AGES 30 TO 34 YEARS
0.2/ 100
METRIC RATING
251st/ 347
METRIC RANK
5.3%
UNEMPLOYMENT AMONG AGES 30 TO 34 YEARS
89.1/ 100
METRIC RATING
101st/ 347
METRIC RANK
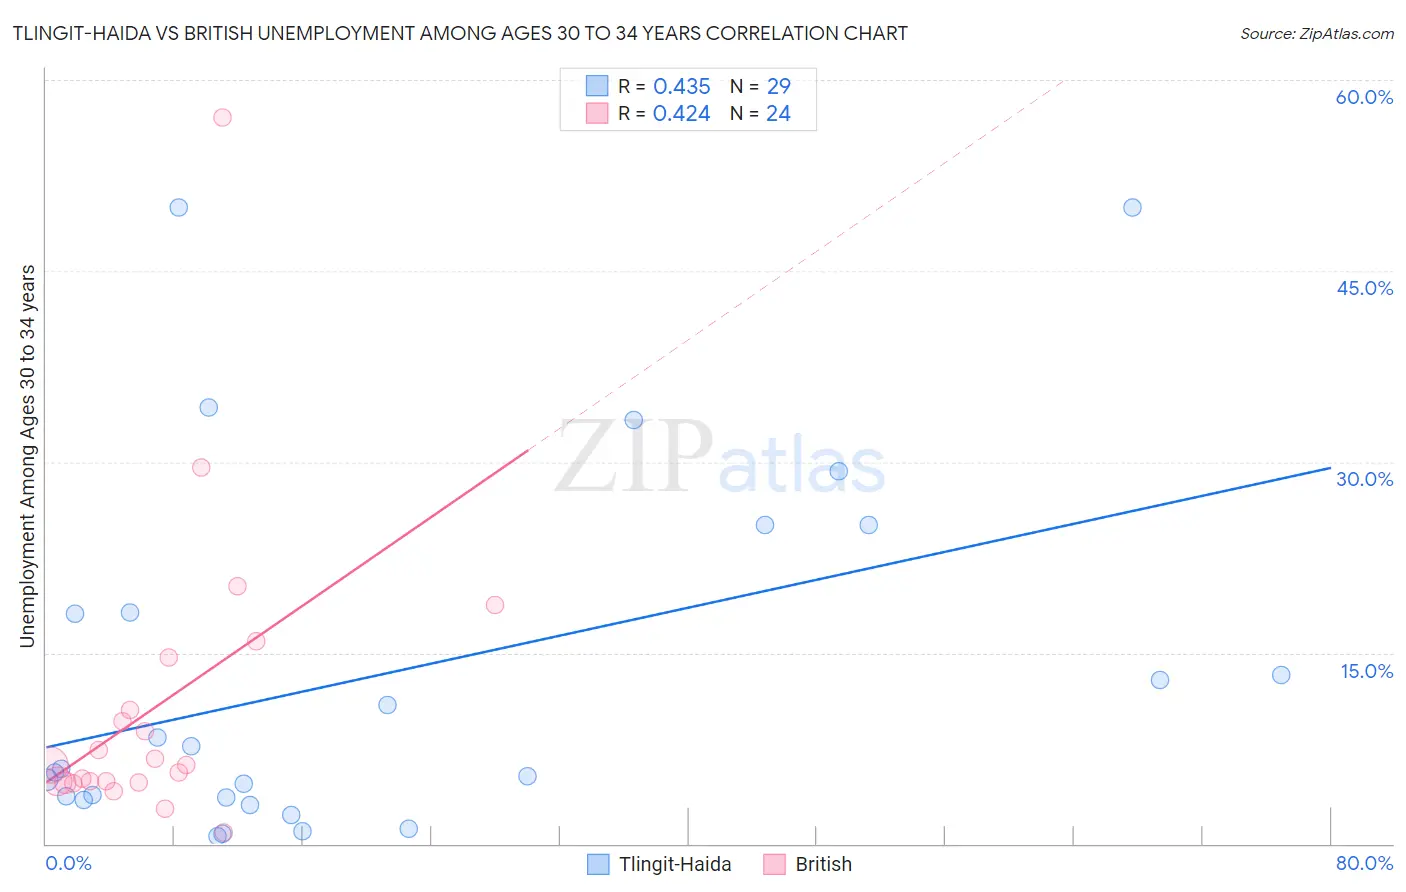
Tlingit-Haida vs British Unemployment Among Ages 30 to 34 years Correlation Chart
The statistical analysis conducted on geographies consisting of 59,624,165 people shows a moderate positive correlation between the proportion of Tlingit-Haida and unemployment rate among population between the ages 30 and 34 in the United States with a correlation coefficient (R) of 0.435 and weighted average of 6.0%. Similarly, the statistical analysis conducted on geographies consisting of 474,684,741 people shows a moderate positive correlation between the proportion of British and unemployment rate among population between the ages 30 and 34 in the United States with a correlation coefficient (R) of 0.424 and weighted average of 5.3%, a difference of 14.7%.
Unemployment Among Ages 30 to 34 years Correlation Summary
| Measurement | Tlingit-Haida | British |
| Minimum | 0.60% | 0.90% |
| Maximum | 50.0% | 57.1% |
| Range | 49.4% | 56.2% |
| Mean | 13.3% | 10.8% |
| Median | 5.9% | 6.2% |
| Interquartile 25% (IQ1) | 3.5% | 4.8% |
| Interquartile 75% (IQ3) | 21.6% | 12.5% |
| Interquartile Range (IQR) | 18.1% | 7.7% |
| Standard Deviation (Sample) | 14.3% | 11.9% |
| Standard Deviation (Population) | 14.0% | 11.6% |
Similar Demographics by Unemployment Among Ages 30 to 34 years
Demographics Similar to Tlingit-Haida by Unemployment Among Ages 30 to 34 years
In terms of unemployment among ages 30 to 34 years, the demographic groups most similar to Tlingit-Haida are Potawatomi (6.0%, a difference of 0.020%), Immigrants from Honduras (6.0%, a difference of 0.20%), Immigrants from Guatemala (6.0%, a difference of 0.29%), Honduran (6.0%, a difference of 0.29%), and Nigerian (6.0%, a difference of 0.30%).
| Demographics | Rating | Rank | Unemployment Among Ages 30 to 34 years |
| Immigrants | Micronesia | 0.3 /100 | #244 | Tragic 6.0% |
| Sub-Saharan Africans | 0.3 /100 | #245 | Tragic 6.0% |
| Ghanaians | 0.3 /100 | #246 | Tragic 6.0% |
| Nigerians | 0.3 /100 | #247 | Tragic 6.0% |
| Immigrants | Guatemala | 0.3 /100 | #248 | Tragic 6.0% |
| Hondurans | 0.3 /100 | #249 | Tragic 6.0% |
| Immigrants | Honduras | 0.3 /100 | #250 | Tragic 6.0% |
| Tlingit-Haida | 0.2 /100 | #251 | Tragic 6.0% |
| Potawatomi | 0.2 /100 | #252 | Tragic 6.0% |
| Immigrants | Nonimmigrants | 0.2 /100 | #253 | Tragic 6.1% |
| Armenians | 0.1 /100 | #254 | Tragic 6.1% |
| Immigrants | Portugal | 0.1 /100 | #255 | Tragic 6.1% |
| Immigrants | Ghana | 0.1 /100 | #256 | Tragic 6.1% |
| Immigrants | Sierra Leone | 0.1 /100 | #257 | Tragic 6.1% |
| Mexicans | 0.1 /100 | #258 | Tragic 6.1% |
Demographics Similar to British by Unemployment Among Ages 30 to 34 years
In terms of unemployment among ages 30 to 34 years, the demographic groups most similar to British are Immigrants from Switzerland (5.3%, a difference of 0.060%), Immigrants from Jordan (5.3%, a difference of 0.070%), Immigrants from Czechoslovakia (5.3%, a difference of 0.080%), Northern European (5.3%, a difference of 0.23%), and Argentinean (5.3%, a difference of 0.23%).
| Demographics | Rating | Rank | Unemployment Among Ages 30 to 34 years |
| Maltese | 92.3 /100 | #94 | Exceptional 5.2% |
| Kenyans | 92.1 /100 | #95 | Exceptional 5.2% |
| Mongolians | 91.7 /100 | #96 | Exceptional 5.2% |
| Europeans | 91.7 /100 | #97 | Exceptional 5.2% |
| Immigrants | North Macedonia | 90.9 /100 | #98 | Exceptional 5.2% |
| Immigrants | Ireland | 90.6 /100 | #99 | Exceptional 5.2% |
| Immigrants | Czechoslovakia | 89.5 /100 | #100 | Excellent 5.3% |
| British | 89.1 /100 | #101 | Excellent 5.3% |
| Immigrants | Switzerland | 88.8 /100 | #102 | Excellent 5.3% |
| Immigrants | Jordan | 88.8 /100 | #103 | Excellent 5.3% |
| Northern Europeans | 87.9 /100 | #104 | Excellent 5.3% |
| Argentineans | 87.9 /100 | #105 | Excellent 5.3% |
| Croatians | 87.6 /100 | #106 | Excellent 5.3% |
| Icelanders | 87.2 /100 | #107 | Excellent 5.3% |
| Immigrants | Middle Africa | 87.1 /100 | #108 | Excellent 5.3% |